Top Rankings
Georgetown Independent School District ranks among the top 20% of public school district in Texas for:
Category
Attribute
Diversity
Most diverse schools (Top 1%)
Community Size
Largest student body (number of students) (Top 1%)
For the 2025 school year, there are 15 public elementary schools serving 9,203 students in Georgetown Independent School District. This district's average elementary testing ranking is 4/10, which is in the bottom 50% of public elementary schools in Texas.
Public Elementary Schools in Georgetown Independent School District have an average math proficiency score of 33% (versus the Texas public elementary school average of 42%), and reading proficiency score of 47% (versus the 52% statewide average).
Minority enrollment is 61% of the student body (majority Hispanic), which is less than the Texas public elementary school average of 75% (majority Hispanic).
Overview
This School District
This State (TX)
# Schools
19 Schools
6,902 Schools
# Students
13,456 Students
3,737,053 Students
# Teachers
969 Teachers
255,471 Teachers
Student : Teacher Ratio
14:1
14:1
District Rank
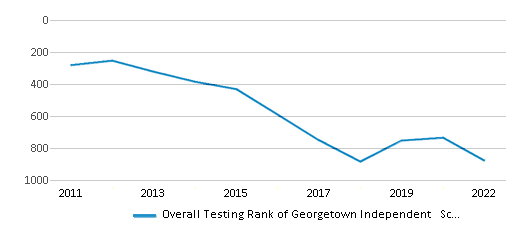
Georgetown Independent School District, which is ranked #855 of all 1,196 school districts in Texas (based off of combined math and reading proficiency testing data) for the 2021-2022 school year.
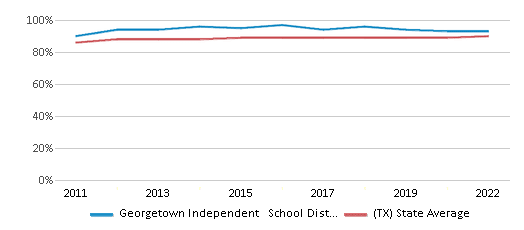
The school district's graduation rate of 93% has decreased from 97% over five school years.
Overall District Rank
#878 out of 1204 school districts
(Bottom 50%)
(Bottom 50%)
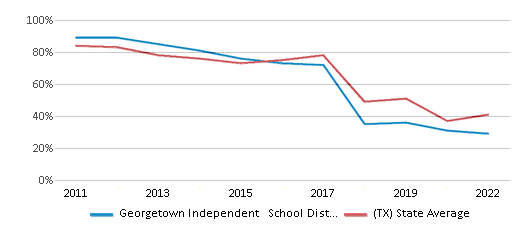
Math Test Scores (% Proficient)
29%
41%
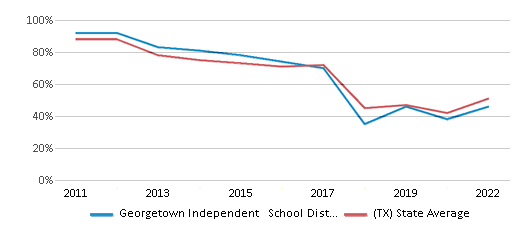
Reading/Language Arts Test Scores (% Proficient)
46%
51%
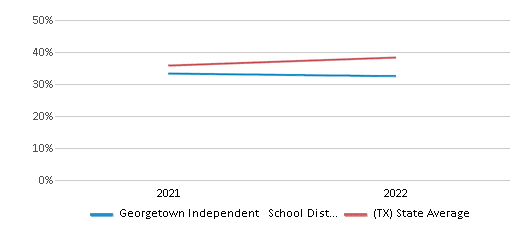
Science Test Scores (% Proficient)
39%
46%
Graduation Rate
93%
90%
Students by Ethnicity:
Diversity Score
0.64
0.64
# American Indian Students
60 Students
11,705 Students
% American Indian Students
n/a
n/a
# Asian Students
452 Students
203,767 Students
% Asian Students
3%
6%
# Hispanic Students
5,942 Students
1,997,454 Students
% Hispanic Students
44%
53%
# Black Students
880 Students
469,194 Students
% Black Students
7%
13%
# White Students
5,446 Students
924,841 Students
% White Students
41%
25%
# Hawaiian Students
19 Students
5,879 Students
% Hawaiian Students
n/a
n/a
# Two or more races Students
657 Students
124,213 Students
% of Two or more races Students
5%
3%
Students by Grade:
# Students in PK Grade:
467
222,501
# Students in K Grade:
888
346,866
# Students in 1st Grade:
929
385,427
# Students in 2nd Grade:
973
402,148
# Students in 3rd Grade:
1,010
399,623
# Students in 4th Grade:
1,004
398,690
# Students in 5th Grade:
960
399,071
# Students in 6th Grade:
953
402,143
# Students in 7th Grade:
1,004
335,034
# Students in 8th Grade:
981
339,814
# Students in 9th Grade:
1,087
32,833
# Students in 10th Grade:
1,111
28,116
# Students in 11th Grade:
1,056
23,862
# Students in 12th Grade:
1,033
20,925
# Ungraded Students:
-
-
District Revenue and Spending
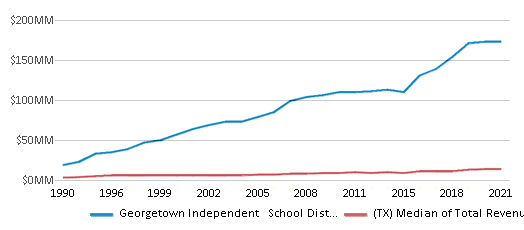
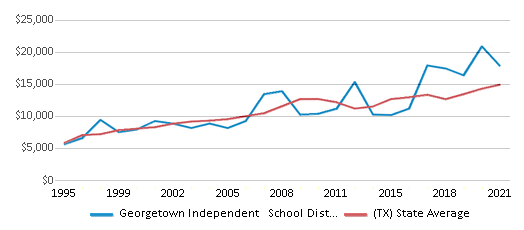
The revenue/student of $12,825 in this school district is less than the state median of $13,387. The school district revenue/student has declined by 11% over four school years.
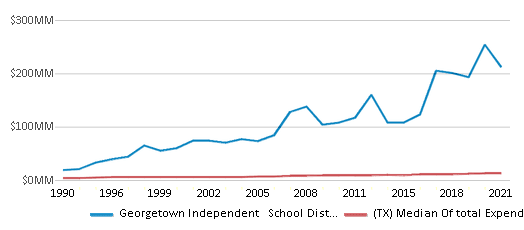
The school district's spending/student of $15,722 is higher than the state median of $14,116. The school district spending/student has declined by 11% over four school years.
Total Revenue
$173 MM
$74,029 MM
Spending
$212 MM
$78,063 MM
Revenue / Student
$12,825
$13,387
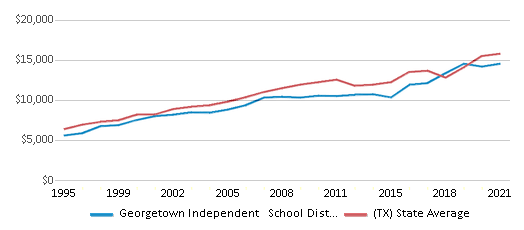
Spending / Student
$15,722
$14,116
Best Georgetown Independent School District Public Elementary Schools (2025)
School
(Math and Reading Proficiency)
(Math and Reading Proficiency)
Location
Grades
Students
Rank: #11.
Raye Mccoy Elementary School
(Math: 52% | Reading: 63%)
Rank:
Rank:
8/
Top 30%10
401 Bellaire Dr
Georgetown, TX 78628
(512) 943-5030
Georgetown, TX 78628
(512) 943-5030
Grades: PK-5
| 504 students
Rank: #22.
Jo Ann Ford Elementary School
(Math: 51% | Reading: 64%)
Rank:
Rank:
8/
Top 30%10
210 Woodlake Dr
Georgetown, TX 78633
(512) 943-5180
Georgetown, TX 78633
(512) 943-5180
Grades: PK-5
| 569 students
Rank: #33.
Douglas Benold Middle School
(Math: 54% | Reading: 58%)
Rank:
Rank:
8/
Top 30%10
3407 Nw Blvd
Georgetown, TX 78628
(512) 943-5090
Georgetown, TX 78628
(512) 943-5090
Grades: 6-8
| 669 students
Rank: #44.
Wolf Ranch Elementary School
(Math: 41% | Reading: 60%)
Rank:
Rank:
7/
Top 50%10
1201 Jay Wolf Dr
Georgetown, TX 78628
(512) 943-5050
Georgetown, TX 78628
(512) 943-5050
Grades: PK-5
| 921 students
Rank: #55.
Carver Elementary School
(Math: 36% | Reading: 55%)
Rank:
Rank:
6/
Top 50%10
4901 Scenic Lake Dr
Georgetown, TX 78626
(512) 943-5070
Georgetown, TX 78626
(512) 943-5070
Grades: PK-5
| 675 students
Rank: #66.
Village Elementary School
(Math: 34% | Reading: 52%)
Rank:
Rank:
5/
Bottom 50%10
400 Village Commons
Georgetown, TX 78633
(512) 943-5140
Georgetown, TX 78633
(512) 943-5140
Grades: PK-5
| 444 students
Rank: #77.
Charles A Forbes Middle School
(Math: 33% | Reading: 50%)
Rank:
Rank:
5/
Bottom 50%10
1911 Ne Inner Loop
Georgetown, TX 78626
(512) 943-5150
Georgetown, TX 78626
(512) 943-5150
Grades: 6-8
| 654 students
Rank: #88.
James E Mitchell Elementary School
(Math: 28% | Reading: 44%)
Rank:
Rank:
3/
Bottom 50%10
1601 Rockride Ln
Georgetown, TX 78626
(512) 943-1820
Georgetown, TX 78626
(512) 943-1820
Grades: PK-5
| 719 students
Rank: #99.
James Tippit Middle School
(Math: 29% | Reading: 40%)
Rank:
Rank:
3/
Bottom 50%10
1601 Leander Rd
Georgetown, TX 78628
(512) 943-5040
Georgetown, TX 78628
(512) 943-5040
Grades: 6-8
| 637 students
Rank: #1010.
Williams Elementary School
(Math: 19% | Reading: 42%)
Rank:
Rank:
2/
Bottom 50%10
4101 Southwestern Blvd
Georgetown, TX 78628
(512) 943-5000
Georgetown, TX 78628
(512) 943-5000
Grades: PK-5
| 822 students
Rank: #1111.
Pat Cooper Elementary School
(Math: 25% | Reading: 35%)
Rank:
Rank:
2/
Bottom 50%10
1921 Ne Inner Loop
Georgetown, TX 78626
(512) 943-5060
Georgetown, TX 78626
(512) 943-5060
Grades: PK-5
| 666 students
Rank: #1212.
Frost Elementary School
(Math: 20-24% | Reading: 30-34%)
Rank:
Rank:
2/
Bottom 50%10
711 Lakeway Dr
Georgetown, TX 78628
(512) 943-5020
Georgetown, TX 78628
(512) 943-5020
Grades: PK-5
| 311 students
Rank: #1313.
George Wagner Middle School
(Math: 16% | Reading: 36%)
Rank:
Rank:
1/
Bottom 50%10
507 E University Ave
Georgetown, TX 78626
(512) 943-1830
Georgetown, TX 78626
(512) 943-1830
Grades: 6-8
| 969 students
Rank: #1414.
Annie Purl Elementary School
(Math: 16% | Reading: 28%)
Rank:
Rank:
1/
Bottom 50%10
1953 Maple St
Georgetown, TX 78626
(512) 943-5080
Georgetown, TX 78626
(512) 943-5080
Grades: PK-5
| 600 students
Rank: n/an/a
Georgetown Alter Prog
Alternative School
502 Patriot Way
Georgetown, TX 78626
(512) 943-5196
Georgetown, TX 78626
(512) 943-5196
Grades: 6-12
| 43 students
Recent Articles

Year-Round Or Traditional Schedule?
Which is more appropriate for your child? A year-round attendance schedule or traditional schedule? We look at the pros and cons.

Why You Should Encourage Your Child to Join a Sports Team
Participating in team sports has a great many benefits for children, there is no doubt. In this article you will learn what those benefits are.

White Students are Now the Minority in U.S. Public Schools
Increasing birth rates among immigrant families from Asia and Central and South America, combined with lower birth rates among white families, means that for the first time in history, public school students in the United States are majority-minority. This shift in demographics poses difficulties for schools as they work to accommodate children of varying language abilities and socio-economic backgrounds.


