For the 2025 school year, there are 5 public schools serving 1,821 students in Lytle Independent School District. This district's average testing ranking is 2/10, which is in the bottom 50% of public schools in Texas.
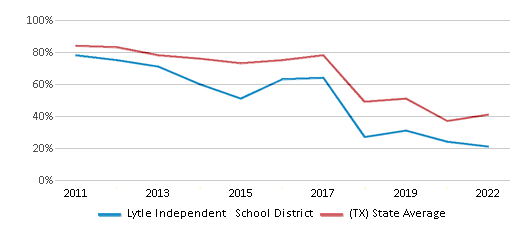
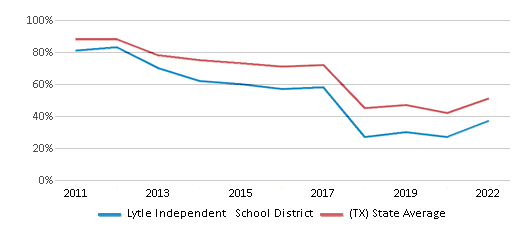
Public Schools in Lytle Independent School District have an average math proficiency score of 21% (versus the Texas public school average of 41%), and reading proficiency score of 37% (versus the 51% statewide average).
Minority enrollment is 87% of the student body (majority Hispanic), which is more than the Texas public school average of 75% (majority Hispanic).
Overview
This School District
This State (TX)
# Schools
5 Schools
9,320 Schools
# Students
1,821 Students
5,529,984 Students
# Teachers
125 Teachers
374,844 Teachers
Student : Teacher Ratio
14:1
14:1
District Rank
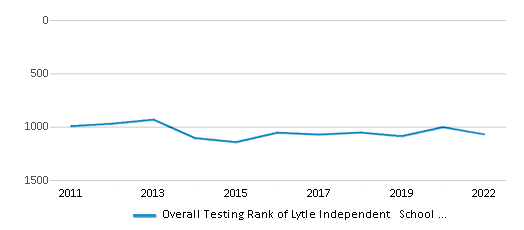
Lytle Independent School District, which is ranked #1077 of all 1,196 school districts in Texas (based off of combined math and reading proficiency testing data) for the 2021-2022 school year.
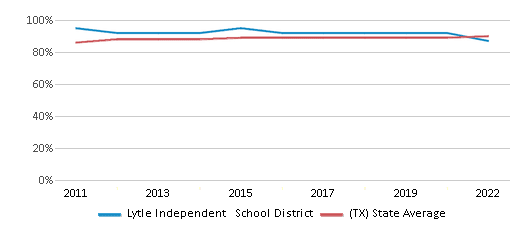
The school district's graduation rate of 85-89% has decreased from 90-94% over five school years.
Overall District Rank
#1071 out of 1204 school districts
(Bottom 50%)
(Bottom 50%)
Math Test Scores (% Proficient)
21%
41%
Reading/Language Arts Test Scores (% Proficient)
37%
51%
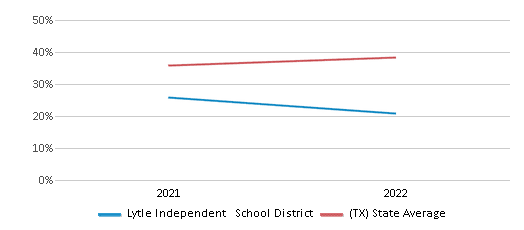
Science Test Scores (% Proficient)
25%
46%
Graduation Rate
85-89%
90%
Students by Ethnicity:
Diversity Score
0.27
0.64
# American Indian Students
7 Students
17,916 Students
% American Indian Students
n/a
n/a
# Asian Students
8 Students
296,049 Students
% Asian Students
n/a
6%
# Hispanic Students
1,539 Students
2,942,422 Students
% Hispanic Students
85%
53%
# Black Students
10 Students
706,008 Students
% Black Students
1%
13%
# White Students
237 Students
1,384,941 Students
% White Students
13%
25%
# Hawaiian Students
n/a
8,841 Students
% Hawaiian Students
n/a
n/a
# Two or more races Students
20 Students
173,807 Students
% of Two or more races Students
1%
3%
Students by Grade:
# Students in PK Grade:
122
275,832
# Students in K Grade:
107
361,958
# Students in 1st Grade:
130
385,427
# Students in 2nd Grade:
132
402,148
# Students in 3rd Grade:
128
399,623
# Students in 4th Grade:
143
398,690
# Students in 5th Grade:
141
399,071
# Students in 6th Grade:
149
402,143
# Students in 7th Grade:
123
406,424
# Students in 8th Grade:
143
414,179
# Students in 9th Grade:
149
472,263
# Students in 10th Grade:
131
438,622
# Students in 11th Grade:
114
406,207
# Students in 12th Grade:
109
367,397
# Ungraded Students:
-
-
District Revenue and Spending
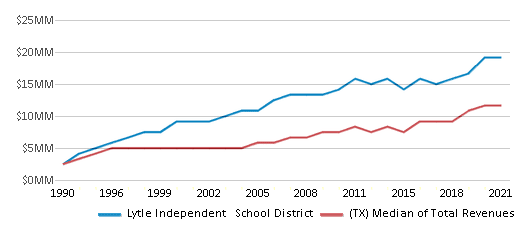
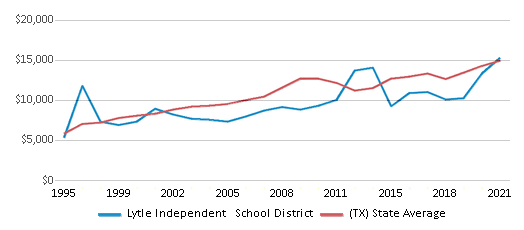
The revenue/student of $12,883 in this school district is less than the state median of $13,387. The school district revenue/student has stayed relatively flat over four school years.
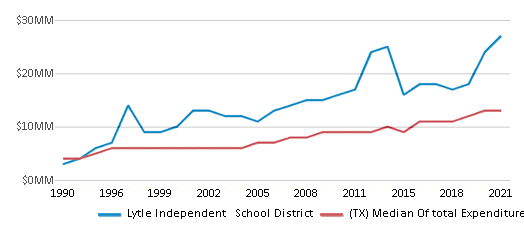
The school district's spending/student of $14,756 is higher than the state median of $14,116. The school district spending/student has stayed relatively flat over four school years.
Total Revenue
$24 MM
$74,029 MM
Spending
$27 MM
$78,063 MM
Revenue / Student
$12,883
$13,387
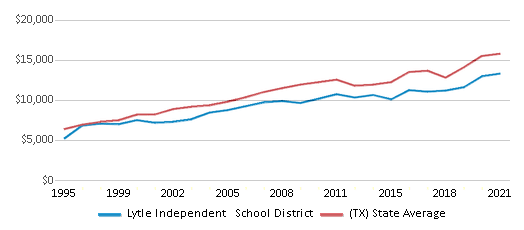
Spending / Student
$14,756
$14,116
Best Lytle Independent School District Public Schools (2025)
School
(Math and Reading Proficiency)
(Math and Reading Proficiency)
Location
Grades
Students
Rank: #11.
Lytle Daep
Alternative School
(Math: <50% | Reading: ≥50%)
Rank:
Rank:
7/
Top 50%10
15437 Cottage St
Lytle, TX 78052
(830) 709-5130
Lytle, TX 78052
(830) 709-5130
Grades: 7-12
| 12 students
Rank: #22.
Lytle J High School
(Math: 23% | Reading: 39%)
Rank:
Rank:
2/
Bottom 50%10
18975 W Fm 2790 S
Lytle, TX 78052
(830) 709-5115
Lytle, TX 78052
(830) 709-5115
Grades: 6-8
| 411 students
Rank: #33.
Lytle Elementary School
(Math: 21% | Reading: 35%)
Rank:
Rank:
2/
Bottom 50%10
11550 Laredo
Lytle, TX 78052
(830) 709-5130
Lytle, TX 78052
(830) 709-5130
Grades: 2-5
| 544 students
Rank: #44.
Lytle High School
(Math: 15-19% | Reading: 35%)
Rank:
Rank:
1/
Bottom 50%10
18975 W Fm 2790 S
Lytle, TX 78052
(830) 709-5105
Lytle, TX 78052
(830) 709-5105
Grades: 9-12
| 495 students
Rank: n/an/a
19126 Prairie St
Lytle, TX 78052
(830) 709-5140
Lytle, TX 78052
(830) 709-5140
Grades: PK-1
| 359 students
Frequently Asked Questions
How many schools belong to Lytle Independent School District?
Lytle Independent School District manages 5 public schools serving 1,821 students.
What is the rank of Lytle Independent School District?
Lytle Independent School District is ranked #1077 out of 1,196 school districts in Texas (bottom 50%) based off of combined math and reading proficiency testing data for the 2021-2022 school year.
What is the racial composition of students in Lytle Independent School District?
85% of Lytle Independent School District students are Hispanic, 13% of students are White, 1% of students are Black, and 1% of students are Two or more races.
What is the student/teacher ratio of Lytle Independent School District?
Lytle Independent School District has a student/teacher ratio of 14:1, which is lower than the Texas state average of 15:1.
What is Lytle Independent School District's spending/student ratio?
The school district's spending/student of $14,756 is higher than the state median of $14,116. The school district spending/student has stayed relatively flat over four school years.
Recent Articles

Year-Round Or Traditional Schedule?
Which is more appropriate for your child? A year-round attendance schedule or traditional schedule? We look at the pros and cons.

Why You Should Encourage Your Child to Join a Sports Team
Participating in team sports has a great many benefits for children, there is no doubt. In this article you will learn what those benefits are.

White Students are Now the Minority in U.S. Public Schools
Increasing birth rates among immigrant families from Asia and Central and South America, combined with lower birth rates among white families, means that for the first time in history, public school students in the United States are majority-minority. This shift in demographics poses difficulties for schools as they work to accommodate children of varying language abilities and socio-economic backgrounds.


