Top Rankings
Richardson Independent School District ranks among the top 20% of public school district in Texas for:
Category
Attribute
Diversity
Most diverse schools (Top 1%)
Community Size
Largest student body (number of students) (Top 1%)
For the 2025 school year, there are 32 public preschools serving 17,107 students in Richardson Independent School District. This district's average pre testing ranking is 6/10, which is in the top 50% of public pre schools in Texas.
Public Preschools in Richardson Independent School District have an average math proficiency score of 47% (versus the Texas public pre school average of 43%), and reading proficiency score of 53% (versus the 53% statewide average).
Minority enrollment is 67% of the student body (majority Hispanic), which is less than the Texas public preschool average of 76% (majority Hispanic).
Overview
This School District
This State (TX)
# Schools
52 Schools
4,192 Schools
# Students
35,804 Students
2,151,418 Students
# Teachers
2,633 Teachers
147,942 Teachers
Student : Teacher Ratio
14:1
14:1
District Rank
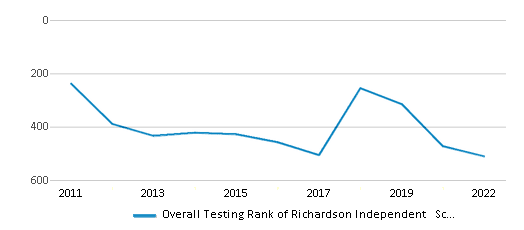
Richardson Independent School District, which is ranked #487 of all 1,196 school districts in Texas (based off of combined math and reading proficiency testing data) for the 2021-2022 school year.
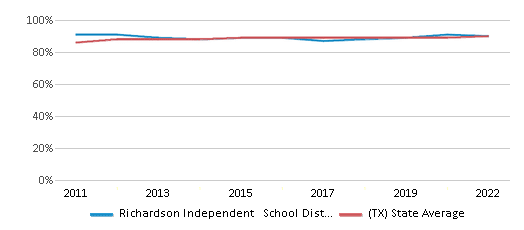
The school district's graduation rate of 90% has increased from 89% over five school years.
Overall District Rank
#511 out of 1204 school districts
(Top 50%)
(Top 50%)
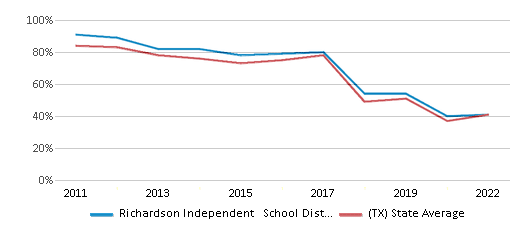
Math Test Scores (% Proficient)
41%
41%
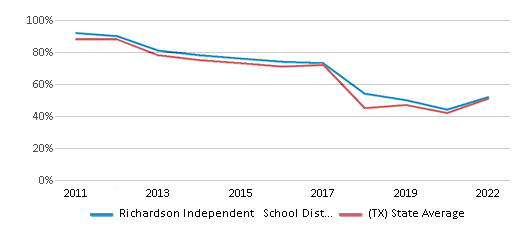
Reading/Language Arts Test Scores (% Proficient)
52%
51%
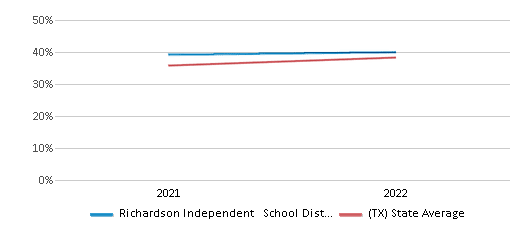
Science Test Scores (% Proficient)
48%
46%
Graduation Rate
90%
90%
Students by Ethnicity:
Diversity Score
0.72
0.63
# American Indian Students
113 Students
6,302 Students
% American Indian Students
n/a
n/a
# Asian Students
2,653 Students
104,203 Students
% Asian Students
8%
5%
# Hispanic Students
13,314 Students
1,180,208 Students
% Hispanic Students
37%
55%
# Black Students
7,459 Students
275,255 Students
% Black Students
21%
13%
# White Students
11,095 Students
509,082 Students
% White Students
31%
24%
# Hawaiian Students
30 Students
3,291 Students
% Hawaiian Students
n/a
n/a
# Two or more races Students
1,140 Students
73,077 Students
% of Two or more races Students
3%
3%
Students by Grade:
# Students in PK Grade:
1,833
275,832
# Students in K Grade:
2,477
307,607
# Students in 1st Grade:
2,629
310,480
# Students in 2nd Grade:
2,611
317,113
# Students in 3rd Grade:
2,633
300,451
# Students in 4th Grade:
2,613
295,281
# Students in 5th Grade:
2,610
258,890
# Students in 6th Grade:
2,571
33,806
# Students in 7th Grade:
2,620
14,241
# Students in 8th Grade:
2,661
12,959
# Students in 9th Grade:
3,005
7,002
# Students in 10th Grade:
2,679
6,366
# Students in 11th Grade:
2,510
5,781
# Students in 12th Grade:
2,352
5,609
# Ungraded Students:
-
-
District Revenue and Spending
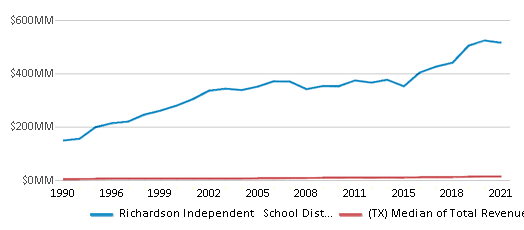
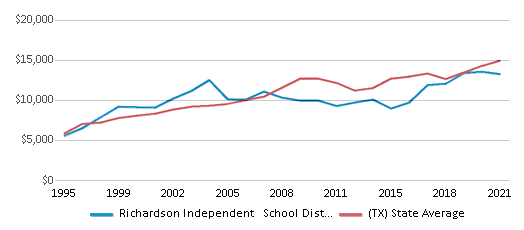
The revenue/student of $14,380 is higher than the state median of $13,387. The school district revenue/student has grown by 5% over four school years.
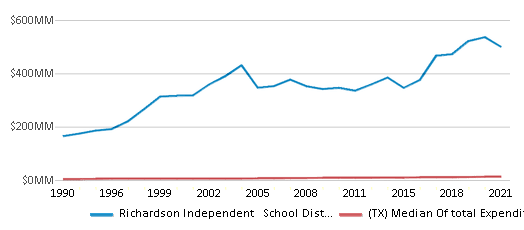
The school district's spending/student of $13,973 is less than the state median of $14,116. The school district spending/student has grown by 5% over four school years.
Total Revenue
$515 MM
$74,029 MM
Spending
$500 MM
$78,063 MM
Revenue / Student
$14,380
$13,387
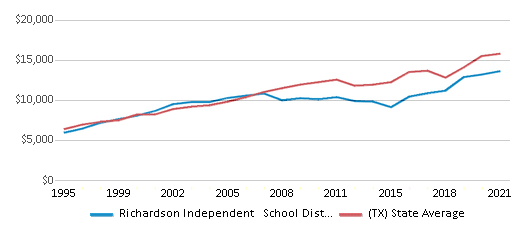
Spending / Student
$13,973
$14,116
Best Richardson Independent School District Public Preschools (2025)
School
(Math and Reading Proficiency)
(Math and Reading Proficiency)
Location
Grades
Students
Rank: #11.
Brentfield Elementary School
(Math: 86% | Reading: 85%)
Rank:
Rank:
10/
Top 1%10
6767 Brentfield Dr
Dallas, TX 75248
(469) 593-5730
Dallas, TX 75248
(469) 593-5730
Grades: PK-6
| 812 students
Rank: #22.
Mohawk Elementary School
(Math: 72% | Reading: 80%)
Rank:
Rank:
10/
Top 5%10
1500 Mimosa Dr
Richardson, TX 75080
(469) 593-6600
Richardson, TX 75080
(469) 593-6600
Grades: PK-6
| 496 students
Rank: #33.
White Rock Elementary School
(Math: 78% | Reading: 75%)
Rank:
Rank:
10/
Top 5%10
9229 Chiswell Rd
Dallas, TX 75238
(469) 593-2700
Dallas, TX 75238
(469) 593-2700
Grades: PK-6
| 1,000 students
Rank: #4 - 54. - 5.
Canyon Creek Elementary School
(Math: 65-69% | Reading: 75-79%)
Rank:
Rank:
10/
Top 10%10
2100 Copper Rdg Dr
Richardson, TX 75080
(469) 593-6500
Richardson, TX 75080
(469) 593-6500
Grades: PK-6
| 304 students
Rank: #4 - 54. - 5.
Spring Creek Elementary School
(Math: 65-69% | Reading: 75-79%)
Rank:
Rank:
10/
Top 10%10
7667 Roundrock Rd
Dallas, TX 75248
(469) 593-4500
Dallas, TX 75248
(469) 593-4500
Grades: PK-6
| 413 students
Rank: #66.
Bowie Elementary School
(Math: 70% | Reading: 74%)
Rank:
Rank:
10/
Top 10%10
7643 La Manga Dr
Dallas, TX 75248
(469) 593-6000
Dallas, TX 75248
(469) 593-6000
Grades: PK-6
| 640 students
Rank: #77.
Moss Haven Elementary School
(Math: 61% | Reading: 71%)
Rank:
Rank:
9/
Top 20%10
9202 Moss Farm Ln
Dallas, TX 75243
(469) 593-2200
Dallas, TX 75243
(469) 593-2200
Grades: PK-6
| 488 students
Rank: #88.
Lake Highlands Elementary School
(Math: 60% | Reading: 71%)
Rank:
Rank:
9/
Top 20%10
9501 Ferndale Rd
Dallas, TX 75238
(469) 593-2100
Dallas, TX 75238
(469) 593-2100
Grades: PK-6
| 780 students
Rank: #99.
Prestonwood Elementary School
(Math: 53% | Reading: 65%)
Rank:
Rank:
9/
Top 20%10
6525 La Cosa
Dallas, TX 75248
(469) 593-6700
Dallas, TX 75248
(469) 593-6700
Grades: PK-6
| 472 students
Rank: #1010.
Jess Harben Elementary School
(Math: 55-59% | Reading: 55-59%)
Rank:
Rank:
8/
Top 30%10
600 S Glenville Dr
Richardson, TX 75081
(469) 593-8800
Richardson, TX 75081
(469) 593-8800
Grades: PK-6
| 377 students
Rank: #1111.
Yale Elementary School
(Math: 54% | Reading: 60%)
Rank:
Rank:
8/
Top 30%10
1900 E Collins Blvd
Richardson, TX 75081
(469) 593-8300
Richardson, TX 75081
(469) 593-8300
Grades: PK-6
| 365 students
Rank: #1212.
Merriman Park Elementary School
(Math: 53% | Reading: 60%)
Rank:
Rank:
8/
Top 30%10
7101 Winedale Dr
Dallas, TX 75231
(469) 593-2800
Dallas, TX 75231
(469) 593-2800
Grades: PK-6
| 514 students
Rank: #1313.
Dartmouth Elementary School
(Math: 45-49% | Reading: 55-59%)
Rank:
Rank:
8/
Top 30%10
417 Dartmouth Ln
Richardson, TX 75081
(469) 593-8400
Richardson, TX 75081
(469) 593-8400
Grades: PK-6
| 361 students
Rank: #1414.
Big Springs Elementary School
(Math: 40-44% | Reading: 55-59%)
Rank:
Rank:
7/
Top 50%10
3301 W Campbell Rd
Garland, TX 75044
(469) 593-8100
Garland, TX 75044
(469) 593-8100
Grades: PK-6
| 401 students
Rank: #1515.
O Henry Elementary School
(Math: 42% | Reading: 54%)
Rank:
Rank:
7/
Top 50%10
4100 Tynes Dr
Garland, TX 75042
(469) 593-8200
Garland, TX 75042
(469) 593-8200
Grades: PK-6
| 471 students
Rank: #1616.
Richardson Terrace Elementary School
(Math: 42% | Reading: 52%)
Rank:
Rank:
6/
Top 50%10
300 N Dorothy Ave
Richardson, TX 75081
(469) 593-8700
Richardson, TX 75081
(469) 593-8700
Grades: PK-6
| 527 students
Rank: #1717.
Hamilton Park Pacesetter Magnet
Magnet School
(Math: 43% | Reading: 50%)
Rank:
Rank:
6/
Top 50%10
8301 Towns St
Dallas, TX 75243
(469) 593-3900
Dallas, TX 75243
(469) 593-3900
Grades: PK-6
| 669 students
Rank: #1818.
Wallace Elementary School
(Math: 42% | Reading: 49%)
Rank:
Rank:
6/
Top 50%10
9921 Kirkhaven Dr
Dallas, TX 75238
(469) 593-2600
Dallas, TX 75238
(469) 593-2600
Grades: PK-6
| 597 students
Rank: #1919.
Northrich Elementary School
(Math: 40-44% | Reading: 45-49%)
Rank:
Rank:
6/
Top 50%10
1301 Custer Rd
Richardson, TX 75080
(469) 593-6200
Richardson, TX 75080
(469) 593-6200
Grades: PK-6
| 345 students
Rank: #2020.
Northlake Elementary School
(Math: 38% | Reading: 47%)
Rank:
Rank:
5/
Bottom 50%10
10059 Ravensway Dr
Dallas, TX 75238
(469) 593-2300
Dallas, TX 75238
(469) 593-2300
Grades: PK-6
| 631 students
Rank: #2121.
Richardson Heights Elementary School
(Math: 40% | Reading: 46%)
Rank:
Rank:
5/
Bottom 50%10
101 N Floyd Rd
Richardson, TX 75080
(469) 593-4400
Richardson, TX 75080
(469) 593-4400
Grades: PK-6
| 488 students
Rank: #2222.
Richland Elementary School
(Math: 35% | Reading: 45%)
Rank:
Rank:
4/
Bottom 50%10
550 Park Bend
Richardson, TX 75081
(469) 593-4650
Richardson, TX 75081
(469) 593-4650
Grades: PK-6
| 609 students
Rank: #2323.
Mark Twain Elementary School
(Math: 33% | Reading: 39%)
Rank:
Rank:
3/
Bottom 50%10
1200 Larkspur Dr
Richardson, TX 75081
(469) 593-4800
Richardson, TX 75081
(469) 593-4800
Grades: PK-6
| 454 students
Rank: #2424.
Stults Road Elementary School
(Math: 27% | Reading: 35%)
Rank:
Rank:
2/
Bottom 50%10
8700 Stults Rd
Dallas, TX 75243
(469) 593-2500
Dallas, TX 75243
(469) 593-2500
Grades: PK-6
| 543 students
Rank: #2525.
Forestridge Elementary School
(Math: 25% | Reading: 36%)
Rank:
Rank:
2/
Bottom 50%10
10330 Bunchberry Dr
Dallas, TX 75243
(469) 593-8500
Dallas, TX 75243
(469) 593-8500
Grades: PK-6
| 506 students
Rank: #2626.
Skyview Elementary School
(Math: 26% | Reading: 33%)
Rank:
Rank:
2/
Bottom 50%10
9229 Meadowknoll Dr
Dallas, TX 75243
(469) 593-2400
Dallas, TX 75243
(469) 593-2400
Grades: PK-6
| 680 students
Rank: #2727.
Aikin Elementary School
(Math: 25% | Reading: 33%)
Rank:
Rank:
2/
Bottom 50%10
12300 Pleasant Vly Dr
Dallas, TX 75243
(469) 593-1820
Dallas, TX 75243
(469) 593-1820
Grades: PK-6
| 518 students
Rank: #2828.
Dover Elementary School
(Math: 22% | Reading: 33%)
Rank:
Rank:
2/
Bottom 50%10
700 Dover Dr
Richardson, TX 75080
(469) 593-4200
Richardson, TX 75080
(469) 593-4200
Grades: PK-6
| 496 students
Rank: #2929.
Carolyn G Bukhair Elementary School
(Math: 27% | Reading: 24%)
Rank:
Rank:
2/
Bottom 50%10
13900 Maham Rd
Dallas, TX 75240
(469) 593-4900
Dallas, TX 75240
(469) 593-4900
Grades: PK-6
| 658 students
Rank: #3030.
Forest Lane Academy
(Math: 25% | Reading: 29%)
Rank:
Rank:
2/
Bottom 50%10
9663 Forest Ln
Dallas, TX 75243
(469) 593-1850
Dallas, TX 75243
(469) 593-1850
Grades: PK-6
| 552 students
Rank: #3131.
Audelia Creek Elementary School
(Math: 16% | Reading: 22%)
Rank:
Rank:
1/
Bottom 50%10
12600 Audelia
Dallas, TX 75243
(469) 593-2900
Dallas, TX 75243
(469) 593-2900
Grades: PK-6
| 582 students
Rank: n/an/a
14040 Rolling Hills Ln
Dallas, TX 75240
(469) 593-4100
Dallas, TX 75240
(469) 593-4100
Grades: PK
| 358 students
Recent Articles

Year-Round Or Traditional Schedule?
Which is more appropriate for your child? A year-round attendance schedule or traditional schedule? We look at the pros and cons.

Why You Should Encourage Your Child to Join a Sports Team
Participating in team sports has a great many benefits for children, there is no doubt. In this article you will learn what those benefits are.

White Students are Now the Minority in U.S. Public Schools
Increasing birth rates among immigrant families from Asia and Central and South America, combined with lower birth rates among white families, means that for the first time in history, public school students in the United States are majority-minority. This shift in demographics poses difficulties for schools as they work to accommodate children of varying language abilities and socio-economic backgrounds.


