For the 2025 school year, there are 3 public elementary schools serving 2,070 students in Rockport-Fulton Independent School District. This district's average elementary testing ranking is 3/10, which is in the bottom 50% of public elementary schools in Texas.
Public Elementary Schools in Rockport-Fulton Independent School District have an average math proficiency score of 29% (versus the Texas public elementary school average of 42%), and reading proficiency score of 43% (versus the 52% statewide average).
Minority enrollment is 54% of the student body (majority Hispanic), which is less than the Texas public elementary school average of 75% (majority Hispanic).
Overview
This School District
This State (TX)
# Schools
4 Schools
6,902 Schools
# Students
2,968 Students
3,737,053 Students
# Teachers
215 Teachers
255,471 Teachers
Student : Teacher Ratio
14:1
14:1
District Rank
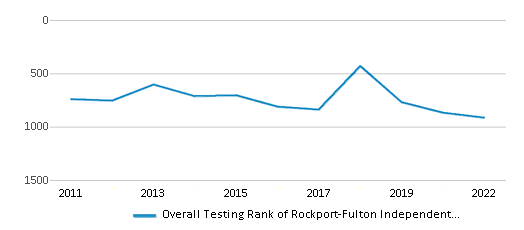
Rockport-Fulton Independent School District, which is ranked #910 of all 1,196 school districts in Texas (based off of combined math and reading proficiency testing data) for the 2021-2022 school year.
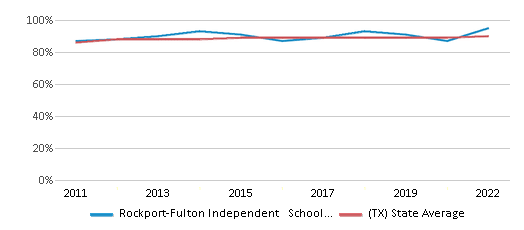
The school district's graduation rate of 95% has increased from 87% over five school years.
Overall District Rank
#915 out of 1204 school districts
(Bottom 50%)
(Bottom 50%)
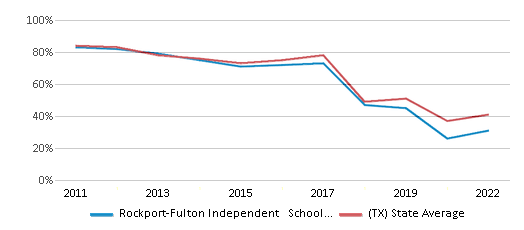
Math Test Scores (% Proficient)
31%
41%
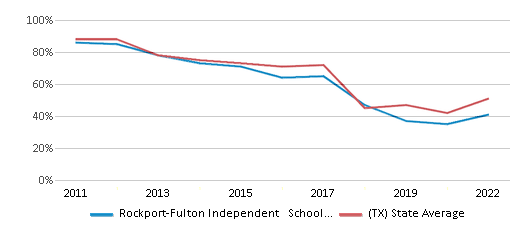
Reading/Language Arts Test Scores (% Proficient)
41%
51%
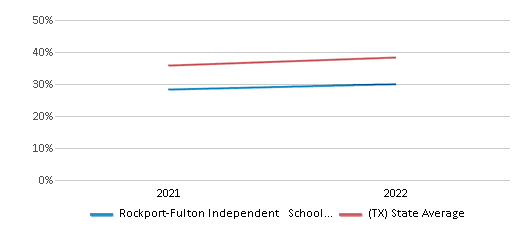
Science Test Scores (% Proficient)
36%
46%
Graduation Rate
95%
90%
Students by Ethnicity:
Diversity Score
0.57
0.64
# American Indian Students
5 Students
11,705 Students
% American Indian Students
n/a
n/a
# Asian Students
54 Students
203,767 Students
% Asian Students
2%
6%
# Hispanic Students
1,330 Students
1,997,454 Students
% Hispanic Students
45%
53%
# Black Students
60 Students
469,194 Students
% Black Students
2%
13%
# White Students
1,420 Students
924,841 Students
% White Students
48%
25%
# Hawaiian Students
8 Students
5,879 Students
% Hawaiian Students
n/a
n/a
# Two or more races Students
91 Students
124,213 Students
% of Two or more races Students
3%
3%
Students by Grade:
# Students in PK Grade:
158
222,501
# Students in K Grade:
193
346,866
# Students in 1st Grade:
200
385,427
# Students in 2nd Grade:
205
402,148
# Students in 3rd Grade:
182
399,623
# Students in 4th Grade:
229
398,690
# Students in 5th Grade:
203
399,071
# Students in 6th Grade:
223
402,143
# Students in 7th Grade:
235
335,034
# Students in 8th Grade:
242
339,814
# Students in 9th Grade:
243
32,833
# Students in 10th Grade:
236
28,116
# Students in 11th Grade:
235
23,862
# Students in 12th Grade:
184
20,925
# Ungraded Students:
-
-
District Revenue and Spending
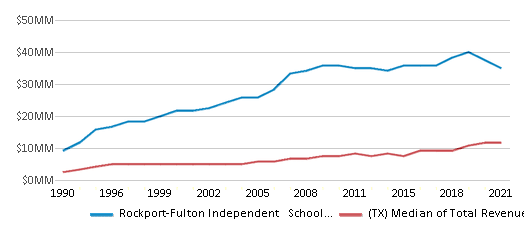
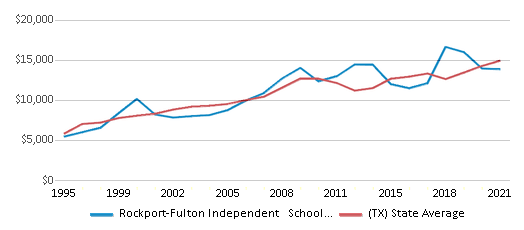
The revenue/student of $13,990 is higher than the state median of $13,387. The school district revenue/student has stayed relatively flat over four school years.
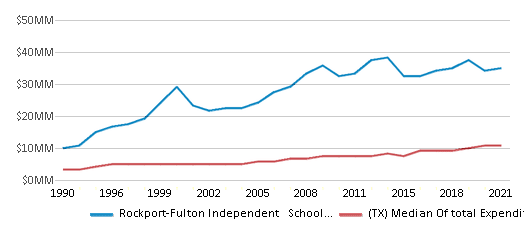
The school district's spending/student of $14,060 is less than the state median of $14,116. The school district spending/student has stayed relatively flat over four school years.
Total Revenue
$42 MM
$74,029 MM
Spending
$42 MM
$78,063 MM
Revenue / Student
$13,990
$13,387
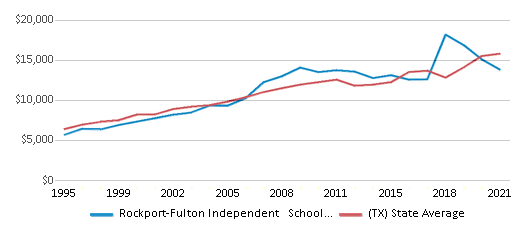
Spending / Student
$14,060
$14,116
Best Rockport-Fulton Independent School District Public Elementary Schools (2025)
School
(Math and Reading Proficiency)
(Math and Reading Proficiency)
Location
Grades
Students
Rank: #11.
Rockport-fulton Middle School
(Math: 35% | Reading: 44%)
Rank:
Rank:
4/
Bottom 50%10
1701 Colorado Ave
Rockport, TX 78381
(361) 790-2230
Rockport, TX 78381
(361) 790-2230
Grades: 6-8
| 700 students
Rank: #22.
Live Oak Learning Center
(Math: 35-39% | Reading: 35-39% )
Rank:
Rank:
4/
Bottom 50%10
31 Griffith Dr
Rockport, TX 78381
(361) 790-2260
Rockport, TX 78381
(361) 790-2260
Grades: PK-2
| 756 students
Rank: #33.
Fulton Learning Center
(Math: 23% | Reading: 41%)
Rank:
Rank:
2/
Bottom 50%10
314 N 6th St
Rockport, TX 78381
(361) 790-2240
Rockport, TX 78381
(361) 790-2240
Grades: 3-5
| 614 students
Recent Articles

Year-Round Or Traditional Schedule?
Which is more appropriate for your child? A year-round attendance schedule or traditional schedule? We look at the pros and cons.

Why You Should Encourage Your Child to Join a Sports Team
Participating in team sports has a great many benefits for children, there is no doubt. In this article you will learn what those benefits are.

White Students are Now the Minority in U.S. Public Schools
Increasing birth rates among immigrant families from Asia and Central and South America, combined with lower birth rates among white families, means that for the first time in history, public school students in the United States are majority-minority. This shift in demographics poses difficulties for schools as they work to accommodate children of varying language abilities and socio-economic backgrounds.


