Top Rankings
Richmond City School District ranks among the top 20% of public school district in Virginia for:
Category
Attribute
Community Size
Largest student body (number of students) (Top 1%)
For the 2025 school year, there are 37 public elementary schools serving 14,954 students in Richmond City School District. This district's average elementary testing ranking is 2/10, which is in the bottom 50% of public elementary schools in Virginia.
Public Elementary Schools in Richmond City School District have an average math proficiency score of 32% (versus the Virginia public elementary school average of 53%), and reading proficiency score of 45% (versus the 67% statewide average).
Minority enrollment is 88% of the student body (majority Black), which is more than the Virginia public elementary school average of 56% (majority Black and Hispanic).
Overview
This School District
This State (VA)
# Schools
54 Schools
1,493 Schools
# Students
20,819 Students
828,856 Students
# Teachers
1,375 Teachers
59,516 Teachers
Student : Teacher Ratio
16:1
16:1
District Rank
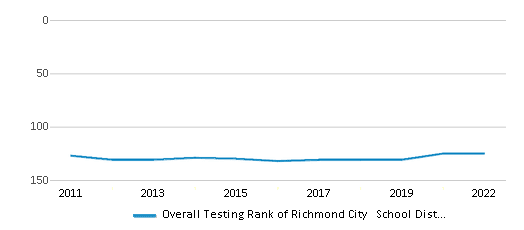
Richmond City School District, which is ranked within the bottom 50% of all 135 school districts in Virginia (based off of combined math and reading proficiency testing data) for the 2020-2021 school year.
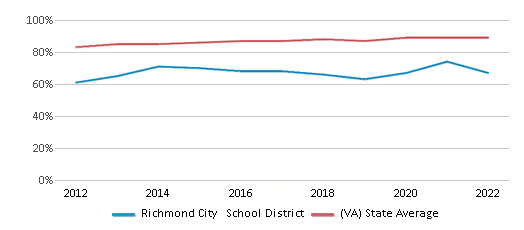
The school district's graduation rate of 67% has decreased from 68% over five school years.
Overall District Rank
#125 out of 135 school districts
(Bottom 50%)
(Bottom 50%)
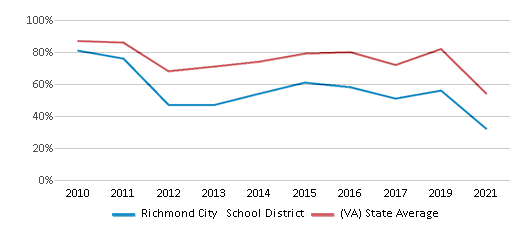
Math Test Scores (% Proficient)
(20-21)32%
54%
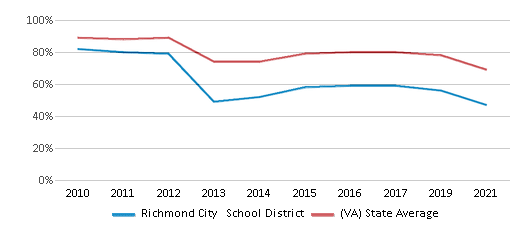
Reading/Language Arts Test Scores (% Proficient)
(20-21)47%
69%
Science Test Scores (% Proficient)
(20-21)43%
59%
Graduation Rate
67%
89%
Students by Ethnicity:
Diversity Score
0.59
0.72
# American Indian Students
46 Students
2,176 Students
% American Indian Students
n/a
n/a
# Asian Students
191 Students
60,924 Students
% Asian Students
1%
8%
# Hispanic Students
5,475 Students
159,503 Students
% Hispanic Students
26%
19%
# Black Students
12,088 Students
177,538 Students
% Black Students
58%
22%
# White Students
2,417 Students
367,233 Students
% White Students
12%
44%
# Hawaiian Students
12 Students
1,248 Students
% Hawaiian Students
n/a
n/a
# Two or more races Students
590 Students
60,234 Students
% of Two or more races Students
3%
7%
Students by Grade:
# Students in PK Grade:
696
27,870
# Students in K Grade:
1,719
84,924
# Students in 1st Grade:
1,816
89,472
# Students in 2nd Grade:
1,757
93,456
# Students in 3rd Grade:
1,632
89,973
# Students in 4th Grade:
1,594
91,712
# Students in 5th Grade:
1,602
92,190
# Students in 6th Grade:
1,568
93,262
# Students in 7th Grade:
1,411
77,704
# Students in 8th Grade:
1,429
76,796
# Students in 9th Grade:
1,503
2,907
# Students in 10th Grade:
1,471
3,055
# Students in 11th Grade:
1,379
2,919
# Students in 12th Grade:
1,242
2,616
# Ungraded Students:
-
-
District Revenue and Spending
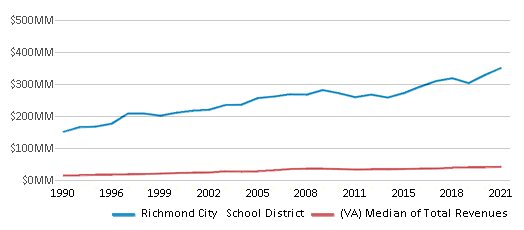
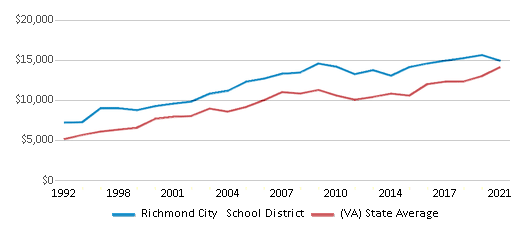
The revenue/student of $20,231 is higher than the state median of $15,502. The school district revenue/student has grown by 35% over four school years.
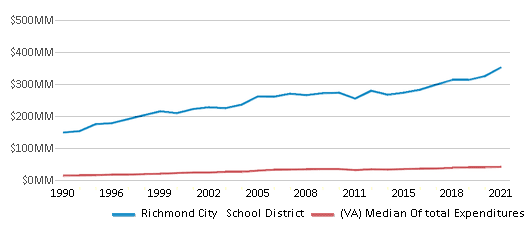
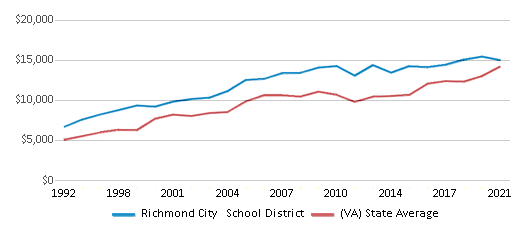
The school district's spending/student of $20,342 is higher than the state median of $15,257. The school district spending/student has grown by 35% over four school years.
Total Revenue
$421 MM
$19,496 MM
Spending
$424 MM
$19,187 MM
Revenue / Student
$20,231
$15,502
Spending / Student
$20,342
$15,257
Best Richmond City School District Public Elementary Schools (2025)
School
(Math and Reading Proficiency)
(Math and Reading Proficiency)
Location
Grades
Students
Rank: #11.
Henry Marsh Iii Elementary School
(Math: 70% | Reading: 80%)
Rank:
Rank:
8/
Top 30%10
813 N 28th St
Richmond, VA 23223
(804) 780-4401
Richmond, VA 23223
(804) 780-4401
Grades: PK-5
| 523 students
Rank: #22.
Richmond Alternative
Alternative School
(Math: 65% | Reading: 82%)
Rank:
Rank:
8/
Top 30%10
119 West Leigh Street
Richmond, VA 23220
(804) 780-4388
Richmond, VA 23220
(804) 780-4388
Grades: 6-12
| 134 students
Rank: #33.
Albert Hill Middle School
(Math: 60-64% | Reading: 75-79%)
Rank:
Rank:
7/
Top 50%10
3400 Patterson Ave
Richmond, VA 23221
(804) 780-6107
Richmond, VA 23221
(804) 780-6107
Grades: 6-8
| 494 students
Rank: #44.
Mary Munford Elementary School
(Math: 60-79% | Reading: 60-79%)
Rank:
Rank:
7/
Top 50%10
211 Westmoreland Street
Richmond, VA 23226
(804) 780-6267
Richmond, VA 23226
(804) 780-6267
Grades: PK-5
| 471 students
Rank: #55.
Linwood Holton Elementary School
(Math: 40-59% | Reading: 60-79%)
Rank:
Rank:
5/
Bottom 50%10
1600 W. Laburnum Ave
Richmond, VA 23227
(804) 228-5310
Richmond, VA 23227
(804) 228-5310
Grades: PK-5
| 439 students
Rank: #66.
Franklin Military Academy
(Math: 35-39% | Reading: 70-74%)
Rank:
Rank:
4/
Bottom 50%10
701 North 37th Street
Richmond, VA 23223
(804) 780-4968
Richmond, VA 23223
(804) 780-4968
Grades: 6-12
| 314 students
Rank: #77.
Fairfield Court Elementary School
(Math: <50% | Reading: <50%)
Rank:
Rank:
3/
Bottom 50%10
2510 Phaup St
Richmond, VA 23223
(804) 780-4639
Richmond, VA 23223
(804) 780-4639
Grades: PK-5
| 227 students
Rank: #88.
Chimborazo Elementary School
(Math: 40-59% | Reading: 40-49%)
Rank:
Rank:
3/
Bottom 50%10
3000 E Marshall St
Richmond, VA 23223
(804) 780-8392
Richmond, VA 23223
(804) 780-8392
Grades: PK-5
| 388 students
Rank: #99.
Henderson Middle School
(Math: 35-39% | Reading: 50-59%)
Rank:
Rank:
3/
Bottom 50%10
4319 Old Brook Rd
Richmond, VA 23227
(804) 780-8288
Richmond, VA 23227
(804) 780-8288
Grades: 6-8
| 450 students
Rank: #1010.
Lucille M. Brown Middle School
(Math: 34% | Reading: 56%)
Rank:
Rank:
2/
Bottom 50%10
6300 Jahnke Rd
Richmond, VA 23225
(804) 319-3013
Richmond, VA 23225
(804) 319-3013
Grades: 6-8
| 541 students
Rank: #1111.
Dogwood Middle School
(Math: 35-39% | Reading: 45-49%)
Rank:
Rank:
2/
Bottom 50%10
1701 Floyd Ave
Richmond, VA 23220
(804) 780-6231
Richmond, VA 23220
(804) 780-6231
Grades: 6-8
| 390 students
Rank: #1212.
Lois Harrison-jones Elementary School
(Math: 21-39% | Reading: <50%)
Rank:
Rank:
2/
Bottom 50%10
3021 Maplewood Ave
Richmond, VA 23221
(804) 780-6252
Richmond, VA 23221
(804) 780-6252
Grades: PK-5
| 232 students
Rank: #1313.
Bellevue Elementary School
(Math: 21-39% | Reading: 40-59%)
Rank:
Rank:
2/
Bottom 50%10
2301 E Grace St
Richmond, VA 23223
(804) 780-4417
Richmond, VA 23223
(804) 780-4417
Grades: PK-5
| 195 students
Rank: #1414.
Swansboro Elementary School
(Math: ≤20% | Reading: 40-59%)
Rank:
Rank:
1/
Bottom 50%10
3160 Midlothian Tnpk
Richmond, VA 23224
(804) 780-5030
Richmond, VA 23224
(804) 780-5030
Grades: PK-5
| 152 students
Rank: #1515.
Woodville Elementary School
(Math: 21-39% | Reading: 21-39%)
Rank:
Rank:
1/
Bottom 50%10
2000 N 28th St
Richmond, VA 23223
(804) 780-4821
Richmond, VA 23223
(804) 780-4821
Grades: PK-5
| 228 students
Rank: #1616.
Blackwell Elementary School
(Math: 20-29% | Reading: 30-39%)
Rank:
Rank:
1/
Bottom 50%10
1600 Everett St
Richmond, VA 23224
(804) 780-5078
Richmond, VA 23224
(804) 780-5078
Grades: PK-5
| 378 students
Rank: #1717.
J.l. Francis Elementary School
(Math: 15-19% | Reading: 35-39%)
Rank:
Rank:
1/
Bottom 50%10
5146 Snead Rd
Richmond, VA 23224
(804) 745-3702
Richmond, VA 23224
(804) 745-3702
Grades: PK-5
| 509 students
Rank: #1818.
Miles Jones Elementary School
(Math: 15-19% | Reading: 30-34%)
Rank:
Rank:
1/
Bottom 50%10
200 Beaufont Hill Drive
Richmond, VA 23225
(804) 319-3185
Richmond, VA 23225
(804) 319-3185
Grades: PK-5
| 506 students
Rank: #1919.
J.b. Fisher Elementary School
(Math: ≤20% | Reading: 21-39%)
Rank:
Rank:
1/
Bottom 50%10
3701 Garden Rd
Richmond, VA 23235
(804) 327-5612
Richmond, VA 23235
(804) 327-5612
Grades: PK-5
| 278 students
Rank: #2020.
Patrick Henry School Of Science And Arts
Charter School
(Math: 10-14% | Reading: 30-39%)
Rank:
Rank:
1/
Bottom 50%10
3411 Semmes Avenue
Richmond, VA 23218
(804) 888-7061
Richmond, VA 23218
(804) 888-7061
Grades: K-5
| 328 students
Rank: #21 - 2221. - 22.
Cardinal Elementary School
(Math: 15-19% | Reading: 15-19%)
Rank:
Rank:
1/
Bottom 50%10
1745 Catalina Dr
Richmond, VA 23224
(804) 780-5082
Richmond, VA 23224
(804) 780-5082
Grades: PK-5
| 849 students
Rank: #21 - 2221. - 22.
Frances W. Mcclenney Elementary School
(Math: ≤10% | Reading: 30-39%)
Rank:
Rank:
1/
Bottom 50%10
3817 Chamberlayne Ave
Richmond, VA 23227
(804) 780-8193
Richmond, VA 23227
(804) 780-8193
Grades: PK-5
| 281 students
Rank: #2323.
River City Middle School
(Math: 14% | Reading: 31%)
Rank:
Rank:
1/
Bottom 50%10
6300 Hull Street Rd
Richmond, VA 23224
(804) 272-7554
Richmond, VA 23224
(804) 272-7554
Grades: 6-8
| 1,177 students
Rank: #24 - 2624. - 26.
Barack Obama Elementary School
(Math: 11-19% | Reading: 20-29%)
Rank:
Rank:
1/
Bottom 50%10
3101 Fendall Ave
Richmond, VA 23222
(804) 780-4879
Richmond, VA 23222
(804) 780-4879
Grades: PK-5
| 280 students
Rank: #24 - 2624. - 26.
George W. Carver Elementary School
(Math: 11-19% | Reading: 20-29%)
Rank:
Rank:
1/
Bottom 50%10
1110 W Leigh St
Richmond, VA 23220
(804) 780-6247
Richmond, VA 23220
(804) 780-6247
Grades: PK-5
| 374 students
Rank: #24 - 2624. - 26.
William Fox Elementary School
(Math: 11-19% | Reading: 20-29%)
Rank:
Rank:
1/
Bottom 50%10
2300 Hanover Ave
Richmond, VA 23220
(804) 780-6259
Richmond, VA 23220
(804) 780-6259
Grades: PK-5
| 334 students
Rank: #27 - 2827. - 28.
Oak Grove/bellemeade Elementary School
(Math: 10-14% | Reading: 25-29%)
Rank:
Rank:
1/
Bottom 50%10
2409 Webber Avenue
Richmond, VA 23224
(804) 780-5008
Richmond, VA 23224
(804) 780-5008
Grades: PK-5
| 523 students
Rank: #27 - 2827. - 28.
Thomas C. Boushall Middle School
(Math: 10-14% | Reading: 25-29%)
Rank:
Rank:
1/
Bottom 50%10
3400 Hopkins Rd
Richmond, VA 23234
(804) 780-5016
Richmond, VA 23234
(804) 780-5016
Grades: 6-8
| 617 students
Rank: #2929.
G.h. Reid Elementary School
(Math: 10-14% | Reading: 15-19%)
Rank:
Rank:
1/
Bottom 50%10
1301 Whitehead Rd
Richmond, VA 23225
(804) 745-3550
Richmond, VA 23225
(804) 745-3550
Grades: PK-5
| 660 students
Rank: #30 - 3230. - 32.
Broad Rock Elementary School
(Math: ≤10% | Reading: 20-29%)
Rank:
Rank:
1/
Bottom 50%10
4615 Ferguson Ln
Richmond, VA 23234
(804) 780-5048
Richmond, VA 23234
(804) 780-5048
Grades: PK-5
| 581 students
Rank: #30 - 3230. - 32.
Overby-sheppard Elementary School
(Math: ≤10% | Reading: 20-29%)
Rank:
Rank:
1/
Bottom 50%10
2300 1st Ave
Richmond, VA 23222
(804) 329-2515
Richmond, VA 23222
(804) 329-2515
Grades: PK-5
| 254 students
Rank: #30 - 3230. - 32.
Southampton Elementary School
(Math: ≤10% | Reading: 20-29%)
Rank:
Rank:
1/
Bottom 50%10
3333 Cheverly Rd
Richmond, VA 23225
(804) 320-2434
Richmond, VA 23225
(804) 320-2434
Grades: PK-5
| 432 students
Rank: #3333.
Westover Hills Elementary School
(Math: ≤10% | Reading: 20-24%)
Rank:
Rank:
1/
Bottom 50%10
1211 Jahnke Rd
Richmond, VA 23225
(804) 780-5002
Richmond, VA 23225
(804) 780-5002
Grades: PK-5
| 365 students
Rank: #3434.
Elizabeth D. Redd Elementary School
(Math: ≤10% | Reading: 11-19%)
Rank:
Rank:
1/
Bottom 50%10
5601 Jahnke Rd
Richmond, VA 23225
(804) 780-5061
Richmond, VA 23225
(804) 780-5061
Grades: PK-5
| 344 students
Rank: #3535.
Amelia Street Special Education
Special Education School
(Math: ≤20% | Reading: ≤20% )
Rank:
Rank:
1/
Bottom 50%10
1821 Amelia St
Richmond, VA 23220
(804) 780-6275
Richmond, VA 23220
(804) 780-6275
Grades: PK-12
| 27 students
Show 2 more public schools in Richmond City School District (out of 37 total schools)
Loading...
Recent Articles

What Is A Charter School?
Explore the world of charter schools in this comprehensive guide. Learn about their history, how they operate, and the pros and cons of this educational innovation. Discover key facts about charter schools, including admission policies, demographics, and funding, as well as what to look for when considering a charter school for your child.

10 Reasons Why High School Sports Benefit Students
Discover the 10 compelling reasons why high school sports are beneficial for students. This comprehensive article explores how athletics enhance academic performance, foster personal growth, and develop crucial life skills. From improved fitness and time management to leadership development and community representation, learn why participating in high school sports can be a game-changer for students' overall success and well-being.

February 05, 2025
Understanding the U.S. Department of Education: Structure, Impact, and EvolutionWe explore how the Department of Education shapes American education, from its cabinet-level leadership to its impact on millions of students, written for general audiences seeking clarity on this vital institution.


