Top Rankings
Rockingham County School District ranks among the top 20% of public school district in Virginia for:
Category
Attribute
Graduation Rate
Highest graduation rate (Top 20%)
Community Size
Largest student body (number of students) (Top 1%)
For the 2025 school year, there are 15 public preschools serving 5,365 students in Rockingham County School District. This district's average pre testing ranking is 3/10, which is in the bottom 50% of public pre schools in Virginia.
Public Preschools in Rockingham County School District have an average math proficiency score of 36% (versus the Virginia public pre school average of 55%), and reading proficiency score of 57% (versus the 66% statewide average).
Minority enrollment is 30% of the student body (majority Hispanic), which is less than the Virginia public preschool average of 56% (majority Hispanic and Black).
Overview
This School District
This State (VA)
# Schools
23 Schools
1,059 Schools
# Students
11,534 Students
522,218 Students
# Teachers
842 Teachers
37,218 Teachers
Student : Teacher Ratio
14:1
14:1
District Rank
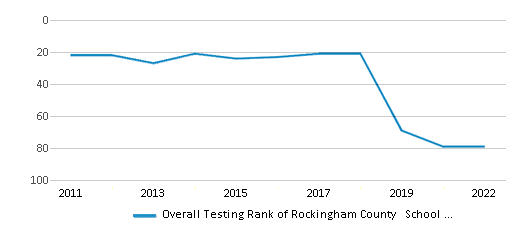
Rockingham County School District, which is ranked within the bottom 50% of all 135 school districts in Virginia (based off of combined math and reading proficiency testing data) for the 2020-2021 school year.
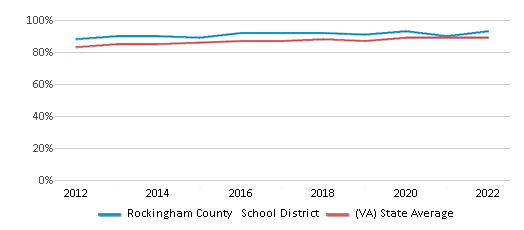
The school district's graduation rate of 93% has increased from 92% over five school years.
Overall District Rank
#79 out of 135 school districts
(Bottom 50%)
(Bottom 50%)
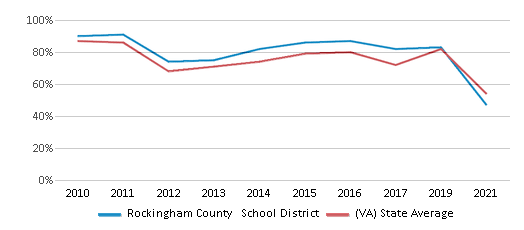
Math Test Scores (% Proficient)
(20-21)47%
54%
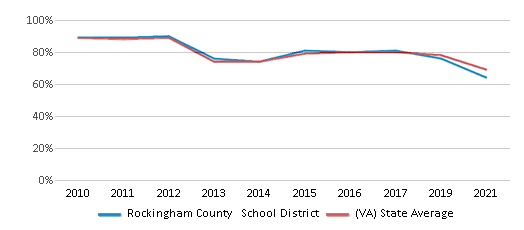
Reading/Language Arts Test Scores (% Proficient)
(20-21)64%
69%
Science Test Scores (% Proficient)
(20-21)57%
59%
Graduation Rate
93%
89%
Students by Ethnicity:
Diversity Score
0.47
0.72
# American Indian Students
29 Students
1,435 Students
% American Indian Students
n/a
n/a
# Asian Students
159 Students
42,355 Students
% Asian Students
1%
8%
# Hispanic Students
2,271 Students
104,836 Students
% Hispanic Students
20%
20%
# Black Students
304 Students
103,630 Students
% Black Students
3%
20%
# White Students
8,130 Students
231,144 Students
% White Students
70%
44%
# Hawaiian Students
4 Students
693 Students
% Hawaiian Students
n/a
n/a
# Two or more races Students
637 Students
38,125 Students
% of Two or more races Students
6%
8%
Students by Grade:
# Students in PK Grade:
405
34,291
# Students in K Grade:
794
76,338
# Students in 1st Grade:
855
80,198
# Students in 2nd Grade:
843
82,775
# Students in 3rd Grade:
788
74,941
# Students in 4th Grade:
846
76,158
# Students in 5th Grade:
834
74,304
# Students in 6th Grade:
816
13,434
# Students in 7th Grade:
854
1,615
# Students in 8th Grade:
868
653
# Students in 9th Grade:
948
1,849
# Students in 10th Grade:
904
1,917
# Students in 11th Grade:
908
1,904
# Students in 12th Grade:
871
1,841
# Ungraded Students:
-
-
District Revenue and Spending
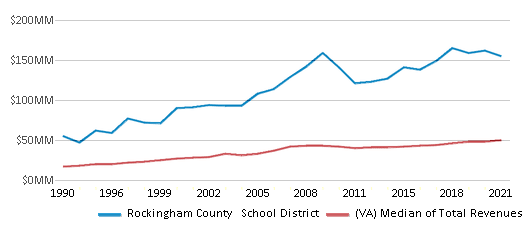
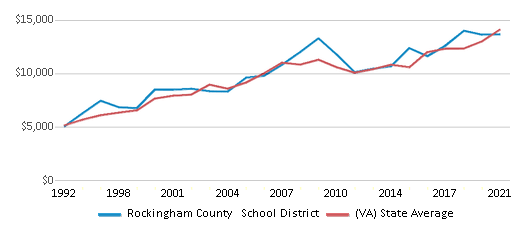
The revenue/student of $13,436 in this school district is less than the state median of $15,502. The school district revenue/student has stayed relatively flat over four school years.
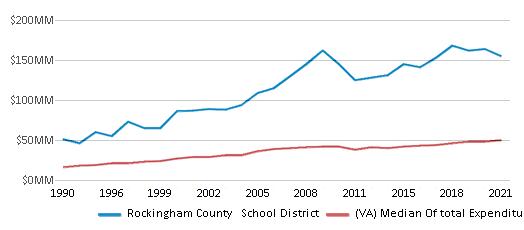
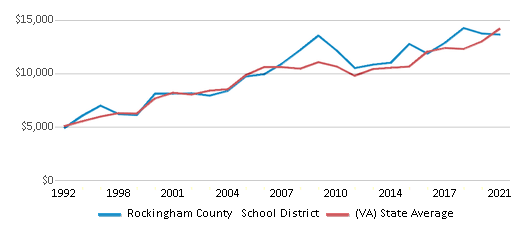
The school district's spending/student of $13,413 is less than the state median of $15,257. The school district spending/student has stayed relatively flat over four school years.
Total Revenue
$155 MM
$19,496 MM
Spending
$155 MM
$19,187 MM
Revenue / Student
$13,436
$15,502
Spending / Student
$13,413
$15,257
Best Rockingham County School District Public Preschools (2025)
School
(Math and Reading Proficiency)
(Math and Reading Proficiency)
Location
Grades
Students
Rank: #11.
Mcgaheysville Elementary School
(Math: 50-54% | Reading: 65-69%)
Rank:
Rank:
5/
Bottom 50%10
9508 Spotswood Trail
Mc Gaheysville, VA 22840
(540) 289-3004
Mc Gaheysville, VA 22840
(540) 289-3004
Grades: PK-5
| 243 students
Rank: #22.
John W. Wayland Elementary School
(Math: 53% | Reading: 63%)
Rank:
Rank:
5/
Bottom 50%10
801 North Main St
Bridgewater, VA 22812
(540) 828-6081
Bridgewater, VA 22812
(540) 828-6081
Grades: PK-5
| 500 students
Rank: #33.
South River Elementary School
(Math: 40-44% | Reading: 65-69%)
Rank:
Rank:
4/
Bottom 50%10
2101 Elm Ave
Grottoes, VA 24441
(540) 249-4001
Grottoes, VA 24441
(540) 249-4001
Grades: PK-5
| 314 students
Rank: #44.
Peak View Elementary School
(Math: 45% | Reading: 61%)
Rank:
Rank:
4/
Bottom 50%10
641 Lawyer Rd.
Penn Laird, VA 22846
(540) 289-7510
Penn Laird, VA 22846
(540) 289-7510
Grades: PK-5
| 536 students
Rank: #55.
Elkton Elementary School
(Math: 25-29% | Reading: 65-69%)
Rank:
Rank:
3/
Bottom 50%10
302 B Street
Elkton, VA 22827
(540) 298-1511
Elkton, VA 22827
(540) 298-1511
Grades: PK-5
| 293 students
Rank: #66.
Pleasant Valley Elementary School
(Math: 40-44% | Reading: 55-59%)
Rank:
Rank:
3/
Bottom 50%10
215 Pleasant Valley Rd
Harrisonburg, VA 22801
(540) 434-4557
Harrisonburg, VA 22801
(540) 434-4557
Grades: PK-5
| 248 students
Rank: #77.
River Bend Elementary School
(Math: 30-34% | Reading: 60-64%)
Rank:
Rank:
3/
Bottom 50%10
14556 Rockingham Pike
Elkton, VA 22827
(540) 298-5301
Elkton, VA 22827
(540) 298-5301
Grades: PK-5
| 342 students
Rank: #88.
Linville-edom Elementary School
(Math: 35-39% | Reading: 55-59%)
Rank:
Rank:
3/
Bottom 50%10
3653 Linville-edom Rd
Linville, VA 22834
(540) 833-6916
Linville, VA 22834
(540) 833-6916
Grades: PK-5
| 179 students
Rank: #99.
Mountain View Elementary School
(Math: 35-39% | Reading: 50-54%)
Rank:
Rank:
2/
Bottom 50%10
2800 Rawley Pike
Harrisonburg, VA 22801
(540) 438-1965
Harrisonburg, VA 22801
(540) 438-1965
Grades: PK-5
| 443 students
Rank: #1010.
Lacey Spring Elementary School
(Math: 25-29% | Reading: 55-59%)
Rank:
Rank:
2/
Bottom 50%10
8621 North Valley Pike
Harrisonburg, VA 22802
(540) 433-7819
Harrisonburg, VA 22802
(540) 433-7819
Grades: PK-5
| 225 students
Rank: #1111.
Cub Run Elementary School
(Math: 35% | Reading: 51%)
Rank:
Rank:
2/
Bottom 50%10
1451 South Montevideo Circle
Penn Laird, VA 22846
(540) 289-5854
Penn Laird, VA 22846
(540) 289-5854
Grades: PK-5
| 751 students
Rank: #1212.
Ottobine Elementary School
(Math: 30-34% | Reading: 45-49%)
Rank:
Rank:
2/
Bottom 50%10
8646 Waggys Creek Rd
Dayton, VA 22821
(540) 879-2091
Dayton, VA 22821
(540) 879-2091
Grades: PK-5
| 189 students
Rank: #1313.
John C. Myers Elementary School
(Math: 21% | Reading: 54%)
Rank:
Rank:
2/
Bottom 50%10
290 Raider Rd
Broadway, VA 22815
(540) 896-2297
Broadway, VA 22815
(540) 896-2297
Grades: PK-5
| 482 students
Rank: #1414.
Fulks Run Elementary School
(Math: 15-19% | Reading: 50-54%)
Rank:
Rank:
2/
Bottom 50%10
11089 Brocks Gap Rd
Fulks Run, VA 22830
(540) 896-7635
Fulks Run, VA 22830
(540) 896-7635
Grades: PK-5
| 154 students
Rank: #1515.
Plains Elementary School
(Math: 25-29% | Reading: 40-44%)
Rank:
Rank:
1/
Bottom 50%10
225 American Legion Dr
Timberville, VA 22853
(540) 896-8956
Timberville, VA 22853
(540) 896-8956
Grades: PK-5
| 466 students
Recent Articles

What Is A Charter School?
Explore the world of charter schools in this comprehensive guide. Learn about their history, how they operate, and the pros and cons of this educational innovation. Discover key facts about charter schools, including admission policies, demographics, and funding, as well as what to look for when considering a charter school for your child.

10 Reasons Why High School Sports Benefit Students
Discover the 10 compelling reasons why high school sports are beneficial for students. This comprehensive article explores how athletics enhance academic performance, foster personal growth, and develop crucial life skills. From improved fitness and time management to leadership development and community representation, learn why participating in high school sports can be a game-changer for students' overall success and well-being.

February 05, 2025
Understanding the U.S. Department of Education: Structure, Impact, and EvolutionWe explore how the Department of Education shapes American education, from its cabinet-level leadership to its impact on millions of students, written for general audiences seeking clarity on this vital institution.


