Top Rankings
Cotati-Rohnert Park Unified School District ranks among the top 20% of public school district in California for:
Category
Attribute
Diversity
Most diverse schools (Top 1%)
Community Size
Largest student body (number of students) (Top 1%)
For the 2025 school year, there are 9 public elementary schools serving 4,039 students in Cotati-Rohnert Park Unified School District. This district's average elementary testing ranking is 5/10, which is in the bottom 50% of public elementary schools in California.
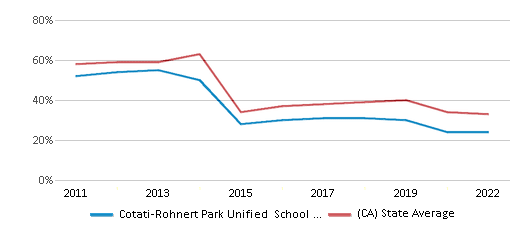
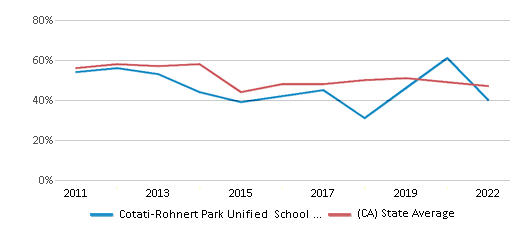
Public Elementary Schools in Cotati-Rohnert Park Unified School District have an average math proficiency score of 25% (versus the California public elementary school average of 35%), and reading proficiency score of 39% (versus the 45% statewide average).
Minority enrollment is 63% of the student body (majority Hispanic), which is less than the California public elementary school average of 79% (majority Hispanic).
Overview
This School District
This State (CA)
# Schools
13 Schools
7,700 Schools
# Students
6,103 Students
3,822,920 Students
# Teachers
277 Teachers
174,006 Teachers
Student : Teacher Ratio
22:1
22:1
District Rank
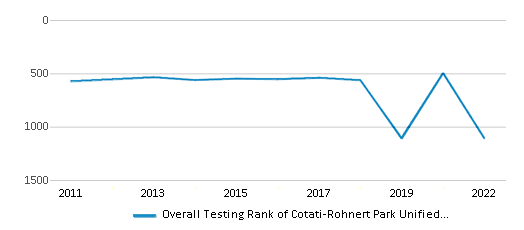
Cotati-Rohnert Park Unified School District, which is ranked #1122 of all 1,925 school districts in California (based off of combined math and reading proficiency testing data) for the 2021-2022 school year.
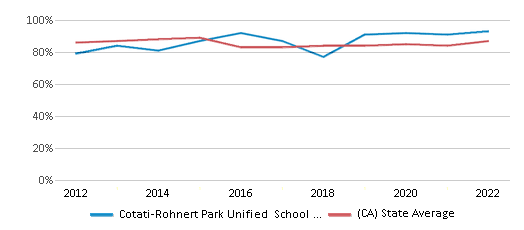
The school district's graduation rate of 93% has increased from 87% over five school years.
Overall District Rank
#1110 out of 1941 school districts
(Bottom 50%)
(Bottom 50%)
Math Test Scores (% Proficient)
24%
33%
Reading/Language Arts Test Scores (% Proficient)
40%
47%
Science Test Scores (% Proficient)
23%
29%
Graduation Rate
93%
87%
Students by Ethnicity:
Diversity Score
0.65
0.64
# American Indian Students
46 Students
16,785 Students
% American Indian Students
1%
1%
# Asian Students
283 Students
454,357 Students
% Asian Students
5%
12%
# Hispanic Students
2,809 Students
2,114,366 Students
% Hispanic Students
46%
55%
# Black Students
129 Students
189,461 Students
% Black Students
2%
5%
# White Students
2,258 Students
787,389 Students
% White Students
37%
21%
# Hawaiian Students
47 Students
15,077 Students
% Hawaiian Students
1%
n/a
# Two or more races Students
521 Students
240,557 Students
% of Two or more races Students
8%
6%
Students by Grade:
# Students in PK Grade:
-
83
# Students in K Grade:
541
519,574
# Students in 1st Grade:
380
396,601
# Students in 2nd Grade:
467
414,466
# Students in 3rd Grade:
413
416,628
# Students in 4th Grade:
437
426,360
# Students in 5th Grade:
433
430,582
# Students in 6th Grade:
401
432,936
# Students in 7th Grade:
465
312,207
# Students in 8th Grade:
502
312,649
# Students in 9th Grade:
522
44,929
# Students in 10th Grade:
503
37,487
# Students in 11th Grade:
550
37,249
# Students in 12th Grade:
489
41,169
# Ungraded Students:
-
-
District Revenue and Spending
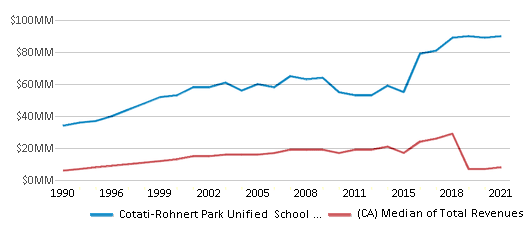
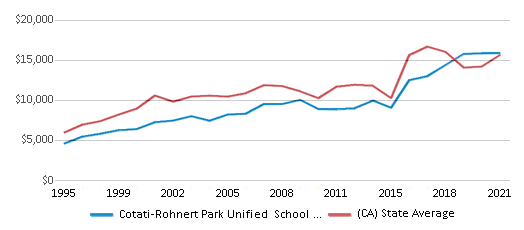
The revenue/student of $14,786 in this school district is less than the state median of $19,974. The school district revenue/student has declined by 6% over four school years.
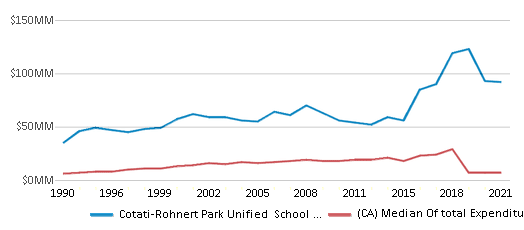
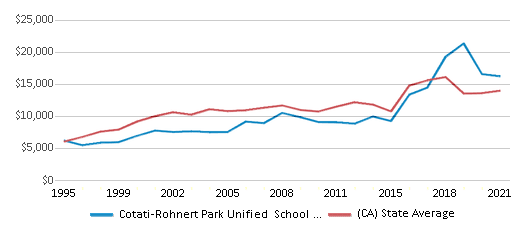
The school district's spending/student of $15,092 is less than the state median of $18,396. The school district spending/student has declined by 6% over four school years.
Total Revenue
$90 MM
$116,387 MM
Spending
$92 MM
$107,188 MM
Revenue / Student
$14,786
$19,974
Spending / Student
$15,092
$18,396
Best Cotati-Rohnert Park Unified School District Public Elementary Schools (2025)
School
(Math and Reading Proficiency)
(Math and Reading Proficiency)
Location
Grades
Students
Rank: #11.
Marguerite Hahn Elementary School
(Math: 48% | Reading: 52%)
Rank:
Rank:
8/
Top 30%10
825 Hudis St.
Rohnert Park, CA 94928
(707) 588-5675
Rohnert Park, CA 94928
(707) 588-5675
Grades: K-5
| 467 students
Rank: #22.
Evergreen Elementary School
(Math: 38% | Reading: 42%)
Rank:
Rank:
6/
Top 50%10
1125 Emily Ave.
Rohnert Park, CA 94928
(707) 588-5715
Rohnert Park, CA 94928
(707) 588-5715
Grades: K-5
| 578 students
Rank: #33.
Monte Vista Elementary School
(Math: 35% | Reading: 38%)
Rank:
Rank:
6/
Top 50%10
1400 Magnolia Ave.
Rohnert Park, CA 94928
(707) 792-4531
Rohnert Park, CA 94928
(707) 792-4531
Grades: K-5
| 464 students
Rank: #44.
University Elementary At La Fiesta
(Math: 30-34% | Reading: 35-39%)
Rank:
Rank:
6/
Top 50%10
8511 Liman Way
Rohnert Park, CA 94928
(707) 792-4840
Rohnert Park, CA 94928
(707) 792-4840
Grades: K-5
| 265 students
Rank: #55.
Lawrence E. Jones Middle School
(Math: 22% | Reading: 47%)
Rank:
Rank:
5/
Bottom 50%10
5154 Snyder Ln.
Rohnert Park, CA 94928
(707) 588-5600
Rohnert Park, CA 94928
(707) 588-5600
Grades: 6-8
| 796 students
Rank: #66.
Thomas Page Academy
(Math: 20% | Reading: 38%)
Rank:
Rank:
4/
Bottom 50%10
1075 Madrone Ave.
Cotati, CA 94931
(707) 792-4860
Cotati, CA 94931
(707) 792-4860
Grades: K-8
| 447 students
Rank: #77.
John Reed Primary
(Math: 17% | Reading: 28%)
Rank:
Rank:
3/
Bottom 50%10
390 Arlen Dr.
Rohnert Park, CA 94928
(707) 792-4845
Rohnert Park, CA 94928
(707) 792-4845
Grades: K-5
| 360 students
Rank: #88.
Richard Crane Elementary School
(Math: 15-19% | Reading: 20-24%)
Rank:
Rank:
2/
Bottom 50%10
1290 Southwest Blvd.
Rohnert Park, CA 94928
(707) 285-3150
Rohnert Park, CA 94928
(707) 285-3150
Grades: K-5
| 257 students
Rank: #99.
Technology Middle School
(Math: 6% | Reading: 21%)
Rank:
Rank:
1/
Bottom 50%10
7165 Burton Ave.
Rohnert Park, CA 94928
(707) 792-4800
Rohnert Park, CA 94928
(707) 792-4800
Grades: 6-8
| 405 students
Recent Articles

Year-Round Or Traditional Schedule?
Which is more appropriate for your child? A year-round attendance schedule or traditional schedule? We look at the pros and cons.

Why You Should Encourage Your Child to Join a Sports Team
Participating in team sports has a great many benefits for children, there is no doubt. In this article you will learn what those benefits are.

White Students are Now the Minority in U.S. Public Schools
Increasing birth rates among immigrant families from Asia and Central and South America, combined with lower birth rates among white families, means that for the first time in history, public school students in the United States are majority-minority. This shift in demographics poses difficulties for schools as they work to accommodate children of varying language abilities and socio-economic backgrounds.


