Top Rankings
Panama-Buena Vista Union School District ranks among the top 20% of public school district in California for:
Category
Attribute
Community Size
Largest student body (number of students) (Top 1%)
For the 2025 school year, there are 25 public schools serving 19,369 students in Panama-Buena Vista Union School District. This district's average testing ranking is 6/10, which is in the top 50% of public schools in California.
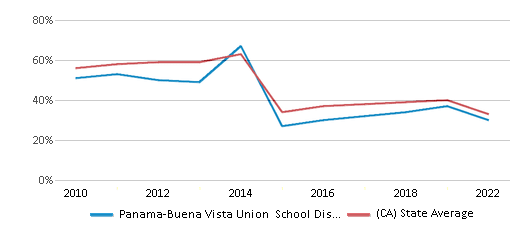
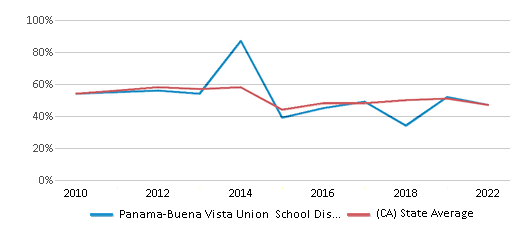
Public Schools in Panama-Buena Vista Union School District have an average math proficiency score of 30% (versus the California public school average of 33%), and reading proficiency score of 47% (versus the 47% statewide average).
Minority enrollment is 86% of the student body (majority Hispanic), which is more than the California public school average of 80% (majority Hispanic).
Overview
This School District
This State (CA)
# Schools
25 Schools
10,369 Schools
# Students
19,369 Students
5,826,838 Students
# Teachers
818 Teachers
268,018 Teachers
Student : Teacher Ratio
24:1
24:1
District Rank
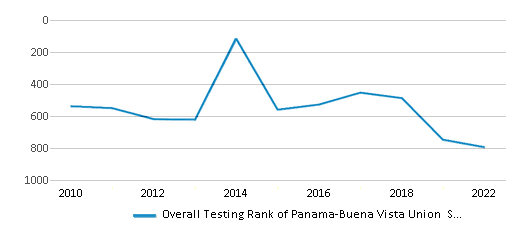
Panama-Buena Vista Union School District, which is ranked #803 of all 1,925 school districts in California (based off of combined math and reading proficiency testing data) for the 2021-2022 school year.
Overall District Rank
#794 out of 1941 school districts
(Top 50%)
(Top 50%)
Math Test Scores (% Proficient)
30%
33%
Reading/Language Arts Test Scores (% Proficient)
47%
47%
Science Test Scores (% Proficient)
26%
29%
Students by Ethnicity:
Diversity Score
0.59
0.63
# American Indian Students
62 Students
25,796 Students
% American Indian Students
n/a
1%
# Asian Students
2,138 Students
705,807 Students
% Asian Students
11%
12%
# Hispanic Students
11,903 Students
3,264,561 Students
% Hispanic Students
62%
56%
# Black Students
1,487 Students
286,112 Students
% Black Students
8%
5%
# White Students
2,648 Students
1,178,558 Students
% White Students
14%
20%
# Hawaiian Students
74 Students
23,731 Students
% Hawaiian Students
n/a
n/a
# Two or more races Students
1,048 Students
333,755 Students
% of Two or more races Students
5%
6%
Students by Grade:
# Students in PK Grade:
-
83
# Students in K Grade:
2,670
522,456
# Students in 1st Grade:
1,895
396,605
# Students in 2nd Grade:
1,959
414,466
# Students in 3rd Grade:
2,024
416,628
# Students in 4th Grade:
2,098
426,361
# Students in 5th Grade:
2,091
430,587
# Students in 6th Grade:
2,110
432,997
# Students in 7th Grade:
2,242
439,621
# Students in 8th Grade:
2,280
441,777
# Students in 9th Grade:
-
466,534
# Students in 10th Grade:
-
476,585
# Students in 11th Grade:
-
469,511
# Students in 12th Grade:
-
492,627
# Ungraded Students:
-
-
District Revenue and Spending
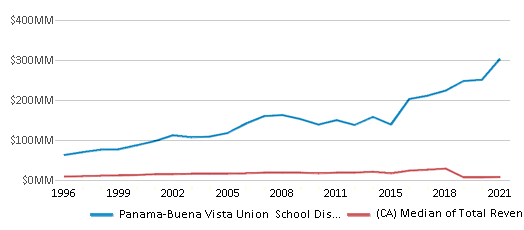
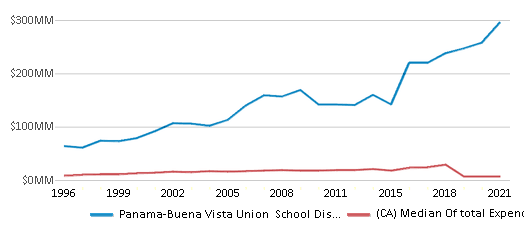
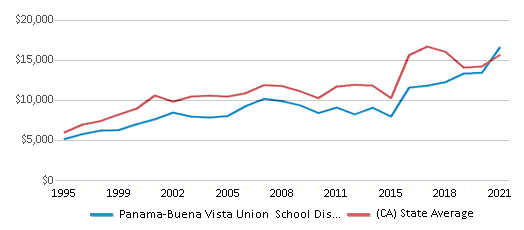
The revenue/student of $15,662 in this school district is less than the state median of $19,974. The school district revenue/student has declined by 5% over four school years.
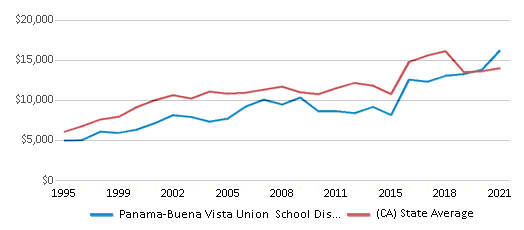
The school district's spending/student of $15,261 is less than the state median of $18,396. The school district spending/student has declined by 5% over four school years.
Total Revenue
$303 MM
$116,387 MM
Spending
$296 MM
$107,188 MM
Revenue / Student
$15,662
$19,974
Spending / Student
$15,261
$18,396
Best Panama-Buena Vista Union School District Public Schools (2025)
School
(Math and Reading Proficiency)
(Math and Reading Proficiency)
Location
Grades
Students
Rank: #11.
Ronald Reagan Elementary School
(Math: 65% | Reading: 71%)
Rank:
Rank:
9/
Top 20%10
10800 Rosslyn Ln.
Bakersfield, CA 93311
(661) 665-8099
Bakersfield, CA 93311
(661) 665-8099
Grades: K-6
| 843 students
Rank: #22.
Highgate Elementary School
(Math: 49% | Reading: 64%)
Rank:
Rank:
9/
Top 20%10
13401 Pemberley Passage Ave.
Bakersfield, CA 93311
(661) 501-1617
Bakersfield, CA 93311
(661) 501-1617
Grades: K-6
| 646 students
Rank: #33.
Earl Warren Junior High School
(Math: 41% | Reading: 70%)
Rank:
Rank:
8/
Top 30%10
4615 Mountain Vista Dr.
Bakersfield, CA 93311
(661) 665-9210
Bakersfield, CA 93311
(661) 665-9210
Grades: 7-8
| 985 students
Rank: #44.
Buena Vista Elementary School
(Math: 45% | Reading: 64%)
Rank:
Rank:
8/
Top 30%10
6547 Buena Vista Rd.
Bakersfield, CA 93311
(661) 831-0818
Bakersfield, CA 93311
(661) 831-0818
Grades: K-6
| 720 students
Rank: #55.
Leo B. Hart Elementary School
(Math: 41% | Reading: 58%)
Rank:
Rank:
8/
Top 30%10
9501 Ridge Oak Dr.
Bakersfield, CA 93311
(661) 664-1296
Bakersfield, CA 93311
(661) 664-1296
Grades: K-6
| 713 students
Rank: #66.
Stockdale Elementary School
(Math: 44% | Reading: 51%)
Rank:
Rank:
7/
Top 50%10
7801 Kroll Way
Bakersfield, CA 93309
(661) 831-7835
Bakersfield, CA 93309
(661) 831-7835
Grades: K-6
| 589 students
Rank: #77.
Old River Elementary School
(Math: 40% | Reading: 52%)
Rank:
Rank:
7/
Top 50%10
9815 Campus Park Dr.
Bakersfield, CA 93311
(661) 664-7009
Bakersfield, CA 93311
(661) 664-7009
Grades: K-6
| 826 students
Rank: #88.
Christa Mcauliffe Elementary School
(Math: 35% | Reading: 50%)
Rank:
Rank:
7/
Top 50%10
8900 Westwold Dr.
Bakersfield, CA 93311
(661) 665-9471
Bakersfield, CA 93311
(661) 665-9471
Grades: K-6
| 522 students
Rank: #99.
Douglas J. Miller Elementary School
(Math: 35% | Reading: 49%)
Rank:
Rank:
7/
Top 50%10
7345 Mountain Ridge Dr.
Bakersfield, CA 93313
(661) 836-6689
Bakersfield, CA 93313
(661) 836-6689
Grades: K-6
| 1,010 students
Rank: #1010.
Panama Elementary School
(Math: 38% | Reading: 45%)
Rank:
Rank:
7/
Top 50%10
9400 Stine Rd.
Bakersfield, CA 93313
(661) 831-1741
Bakersfield, CA 93313
(661) 831-1741
Grades: K-6
| 868 students
Rank: #1111.
Dolores S. Whitley Tk-8
(Math: 34% | Reading: 48%)
Rank:
Rank:
7/
Top 50%10
2923 Mckee Rd.
Bakersfield, CA 93313
(661) 885-6600
Bakersfield, CA 93313
(661) 885-6600
Grades: K-8
| 1,092 students
Rank: #1212.
Tevis Junior High School
(Math: 25% | Reading: 50%)
Rank:
Rank:
6/
Top 50%10
3901 Pin Oak Park Blvd.
Bakersfield, CA 93311
(661) 664-7211
Bakersfield, CA 93311
(661) 664-7211
Grades: 7-8
| 842 students
Rank: #1313.
Bill L. Williams Elementary School
(Math: 30% | Reading: 43%)
Rank:
Rank:
6/
Top 50%10
5601 Harris Rd.
Bakersfield, CA 93313
(661) 837-8070
Bakersfield, CA 93313
(661) 837-8070
Grades: K-6
| 962 students
Rank: #1414.
Roy W. Loudon Elementary School
(Math: 24% | Reading: 45%)
Rank:
Rank:
5/
Bottom 50%10
4000 Loudon St.
Bakersfield, CA 93313
(661) 398-3210
Bakersfield, CA 93313
(661) 398-3210
Grades: K-6
| 749 students
Rank: #1515.
Louise Sandrini Elementary School
(Math: 25% | Reading: 40%)
Rank:
Rank:
5/
Bottom 50%10
4100 Alum Ave.
Bakersfield, CA 93309
(661) 397-1515
Bakersfield, CA 93309
(661) 397-1515
Grades: K-6
| 603 students
Rank: #1616.
Berkshire Elementary School
(Math: 25% | Reading: 39%)
Rank:
Rank:
5/
Bottom 50%10
3900 Berkshire Rd.
Bakersfield, CA 93313
(661) 834-9472
Bakersfield, CA 93313
(661) 834-9472
Grades: K-6
| 923 students
Rank: #1717.
Charles H. Castle Elementary School
(Math: 25% | Reading: 38%)
Rank:
Rank:
5/
Bottom 50%10
6001 Edgemont Dr.
Bakersfield, CA 93309
(661) 834-5311
Bakersfield, CA 93309
(661) 834-5311
Grades: K-6
| 844 students
Rank: #1818.
Sing Lum Elementary School
(Math: 24% | Reading: 38%)
Rank:
Rank:
5/
Bottom 50%10
4600 Chaney Ln.
Bakersfield, CA 93311
(661) 664-1611
Bakersfield, CA 93311
(661) 664-1611
Grades: K-6
| 771 students
Rank: #1919.
Stonecreek Junior High School
(Math: 20% | Reading: 44%)
Rank:
Rank:
5/
Bottom 50%10
8000 Akers Rd.
Bakersfield, CA 93313
(661) 834-4521
Bakersfield, CA 93313
(661) 834-4521
Grades: 7-8
| 1,012 students
Rank: #2020.
Laurelglen Elementary School
(Math: 23% | Reading: 33%)
Rank:
Rank:
4/
Bottom 50%10
2601 El Portal Dr.
Bakersfield, CA 93309
(661) 831-4444
Bakersfield, CA 93309
(661) 831-4444
Grades: K-6
| 529 students
Rank: #2121.
O. J. Actis Junior High School
(Math: 16% | Reading: 40%)
Rank:
Rank:
4/
Bottom 50%10
2400 Westholme Blvd.
Bakersfield, CA 93309
(661) 833-1250
Bakersfield, CA 93309
(661) 833-1250
Grades: 7-8
| 700 students
Rank: #2222.
Stine Elementary School
(Math: 18% | Reading: 34%)
Rank:
Rank:
4/
Bottom 50%10
4300 Wilson Rd.
Bakersfield, CA 93309
(661) 831-1022
Bakersfield, CA 93309
(661) 831-1022
Grades: K-6
| 607 students
Rank: #2323.
Amy B. Seibert Elementary School
(Math: 20% | Reading: 27%)
Rank:
Rank:
3/
Bottom 50%10
2800 Agate St.
Bakersfield, CA 93304
(661) 832-4141
Bakersfield, CA 93304
(661) 832-4141
Grades: K-6
| 654 students
Rank: #2424.
Wayne Van Horn Elementary School
(Math: 17% | Reading: 30%)
Rank:
Rank:
3/
Bottom 50%10
5501 Kleinpell Ave.
Bakersfield, CA 93309
(661) 324-6538
Bakersfield, CA 93309
(661) 324-6538
Grades: K-6
| 597 students
Rank: #2525.
Fred L. Thompson Junior High School
(Math: 10% | Reading: 37%)
Rank:
Rank:
3/
Bottom 50%10
4200 Planz Rd.
Bakersfield, CA 93309
(661) 832-8011
Bakersfield, CA 93309
(661) 832-8011
Grades: 7-8
| 762 students
Frequently Asked Questions
How many schools belong to Panama-Buena Vista Union School District?
Panama-Buena Vista Union School District manages 25 public schools serving 19,369 students.
What is the rank of Panama-Buena Vista Union School District?
Panama-Buena Vista Union School District is ranked #803 out of 1,925 school districts in California (top 50%) based off of combined math and reading proficiency testing data for the 2021-2022 school year. This district ranks in the top 20% of California school districts for: Largest student body (number of students) (Top 1%)
What is the racial composition of students in Panama-Buena Vista Union School District?
62% of Panama-Buena Vista Union School District students are Hispanic, 14% of students are White, 11% of students are Asian, 8% of students are Black, and 5% of students are Two or more races.
What is the student/teacher ratio of Panama-Buena Vista Union School District?
Panama-Buena Vista Union School District has a student/teacher ratio of 24:1, which is higher than the California state average of 22:1.
What is Panama-Buena Vista Union School District's spending/student ratio?
The school district's spending/student of $15,261 is less than the state median of $18,396. The school district spending/student has declined by 5% over four school years.
Recent Articles

Year-Round Or Traditional Schedule?
Which is more appropriate for your child? A year-round attendance schedule or traditional schedule? We look at the pros and cons.

Why You Should Encourage Your Child to Join a Sports Team
Participating in team sports has a great many benefits for children, there is no doubt. In this article you will learn what those benefits are.

White Students are Now the Minority in U.S. Public Schools
Increasing birth rates among immigrant families from Asia and Central and South America, combined with lower birth rates among white families, means that for the first time in history, public school students in the United States are majority-minority. This shift in demographics poses difficulties for schools as they work to accommodate children of varying language abilities and socio-economic backgrounds.


