Top Rankings
District Of Columbia School District ranks among the top 20% of public school district in District Of Columbia for:
Category
Attribute
Reading/Language Arts Proficiency
Highest reading/language arts proficiency (Top 20%)
Community Size
Largest student body (number of students) (Top 1%)
For the 2025 school year, there are 79 public preschools serving 29,473 students in District Of Columbia School District. This district's average pre testing ranking is 7/10, which is in the top 50% of public pre schools in District Of Columbia.
Public Preschools in District Of Columbia School District have an average math proficiency score of 28% (versus the District Of Columbia public pre school average of 25%), and reading proficiency score of 34% (versus the 31% statewide average).
Minority enrollment is 78% of the student body (majority Black), which is less than the District Of Columbia public preschool average of 83% (majority Black).
Overview
This School District
This State (DC)
# Schools
116 Schools
146 Schools
# Students
50,310 Students
50,312 Students
# Teachers
4,527 Teachers
4,588 Teachers
Student : Teacher Ratio
11:1
11:1
District Rank
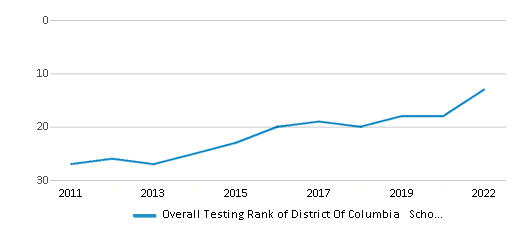
District Of Columbia School District, which is ranked within the top 30% of all 57 school districts in District Of Columbia (based off of combined math and reading proficiency testing data) for the 2021-2022 school year.
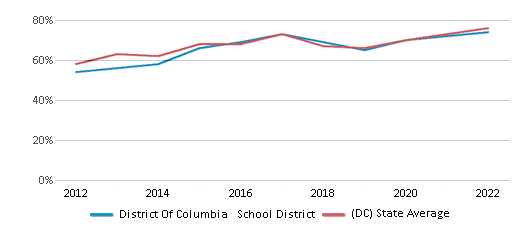
The school district's graduation rate of 74% has increased from 73% over five school years.
Overall District Rank
#13 out of 57 school districts
(Top 30%)
(Top 30%)
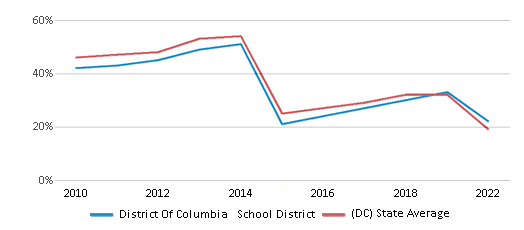
Math Test Scores (% Proficient)
22%
19%
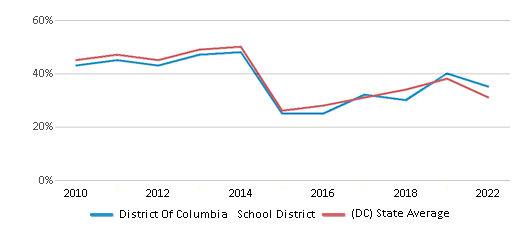
Reading/Language Arts Test Scores (% Proficient)
35%
31%
Science Test Scores (% Proficient)
12%
10%
Graduation Rate
74%
76%
Students by Ethnicity:
Diversity Score
0.62
0.60
# American Indian Students
59 Students
86 Students
% American Indian Students
n/a
n/a
# Asian Students
985 Students
817 Students
% Asian Students
2%
2%
# Hispanic Students
11,161 Students
9,364 Students
% Hispanic Students
22%
19%
# Black Students
28,055 Students
29,273 Students
% Black Students
55%
58%
# White Students
8,829 Students
8,634 Students
% White Students
18%
17%
# Hawaiian Students
25 Students
28 Students
% Hawaiian Students
n/a
n/a
# Two or more races Students
1,603 Students
2,077 Students
% of Two or more races Students
3%
4%
Students by Grade:
# Students in PK Grade:
5,735
12,099
# Students in K Grade:
4,013
7,036
# Students in 1st Grade:
4,035
6,392
# Students in 2nd Grade:
4,046
6,349
# Students in 3rd Grade:
3,898
6,068
# Students in 4th Grade:
3,803
5,175
# Students in 5th Grade:
3,476
4,530
# Students in 6th Grade:
2,635
867
# Students in 7th Grade:
2,567
799
# Students in 8th Grade:
2,694
746
# Students in 9th Grade:
4,395
-
# Students in 10th Grade:
3,591
-
# Students in 11th Grade:
2,949
-
# Students in 12th Grade:
2,473
-
# Ungraded Students:
-
251
District Revenue and Spending
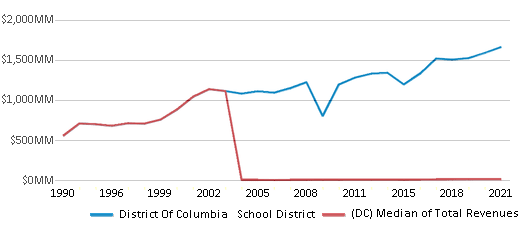
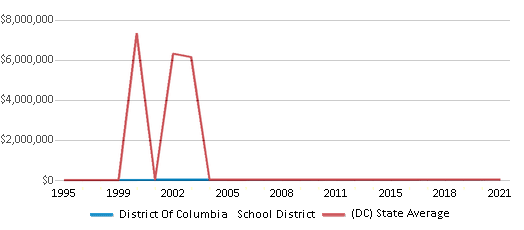
The revenue/student of $33,091 is higher than the state median of $31,299. The school district revenue/student has stayed relatively flat over four school years.
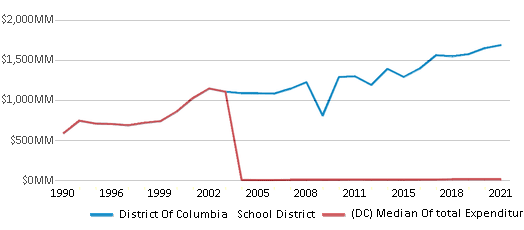
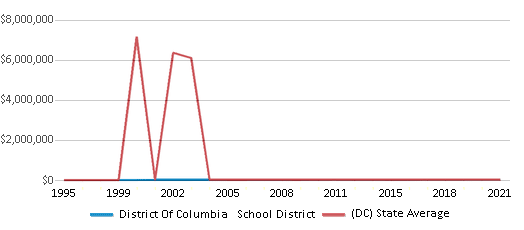
The school district's spending/student of $33,584 is higher than the state median of $31,192. The school district spending/student has stayed relatively flat over four school years.
Total Revenue
$1,665 MM
$2,882 MM
Spending
$1,690 MM
$2,873 MM
Revenue / Student
$33,091
$31,299
Spending / Student
$33,584
$31,192
Best District Of Columbia School District Public Preschools (2025)
School
(Math and Reading Proficiency)
(Math and Reading Proficiency)
Location
Grades
Students
Rank: #11.
Janney Elementary School
(Math: 85% | Reading: 86%)
Rank:
Rank:
10/
Top 1%10
4130 Albemarle St. Nw
Washington, DC 20016
(202) 282-0110
Washington, DC 20016
(202) 282-0110
Grades: PK-5
| 684 students
Rank: #22.
Key Elementary School
(Math: 70-74% | Reading: 85-89%)
Rank:
Rank:
10/
Top 1%10
5001 Dana Pl. Nw
Washington, DC 20016
(202) 729-3280
Washington, DC 20016
(202) 729-3280
Grades: PK-5
| 347 students
Rank: #33.
Lafayette Elementary School
(Math: 76% | Reading: 75%)
Rank:
Rank:
10/
Top 5%10
5701 Broad Branch Rd. Nw
Washington, DC 20015
(202) 282-0116
Washington, DC 20015
(202) 282-0116
Grades: PK-5
| 933 students
Rank: #44.
Stoddert Elementary School
(Math: 75-79% | Reading: 70-74%)
Rank:
Rank:
10/
Top 5%10
4001 Calvert St. Nw
Washington, DC 20007
(202) 671-6030
Washington, DC 20007
(202) 671-6030
Grades: PK-5
| 447 students
Rank: #55.
Ross Elementary School
(Math: 60-69% | Reading: 80-89%)
Rank:
Rank:
10/
Top 5%10
1730 R St. Nw
Washington, DC 20009
(202) 673-7200
Washington, DC 20009
(202) 673-7200
Grades: PK-5
| 182 students
Rank: #66.
Mann Elementary School
(Math: 65-69% | Reading: 70-74%)
Rank:
Rank:
10/
Top 5%10
4430 Newark St. Nw
Washington, DC 20016
(202) 282-0126
Washington, DC 20016
(202) 282-0126
Grades: PK-5
| 394 students
Rank: #77.
Brent Elementary School
(Math: 65-69% | Reading: 65-69%)
Rank:
Rank:
10/
Top 5%10
301 North Carolina Ave. Se
Washington, DC 20003
(202) 698-3363
Washington, DC 20003
(202) 698-3363
Grades: PK-5
| 421 students
Rank: #88.
Hearst Elementary School
(Math: 60-64% | Reading: 70-74%)
Rank:
Rank:
10/
Top 5%10
3950 37th St. Nw
Washington, DC 20008
(202) 282-0106
Washington, DC 20008
(202) 282-0106
Grades: PK-5
| 337 students
Rank: #99.
Eaton Elementary School
(Math: 64% | Reading: 69%)
Rank:
Rank:
10/
Top 10%10
3301 Lowell St Nw
Washington, DC 20008
(202) 282-0103
Washington, DC 20008
(202) 282-0103
Grades: PK-5
| 437 students
Rank: #10 - 1110. - 11.
Maury Elementary School
(Math: 55-59% | Reading: 65-69%)
Rank:
Rank:
10/
Top 10%10
1250 Constitution Ave. Ne
Washington, DC 20002
(202) 698-3838
Washington, DC 20002
(202) 698-3838
Grades: PK-5
| 549 students
Rank: #10 - 1110. - 11.
Murch Elementary School
(Math: 64% | Reading: 66%)
Rank:
Rank:
10/
Top 10%10
4810 36th St. Nw
Washington, DC 20008
(202) 282-0130
Washington, DC 20008
(202) 282-0130
Grades: PK-5
| 636 students
Rank: #1212.
Hyde-addison Elementary School
(Math: 55-59% | Reading: 60-64%)
Rank:
Rank:
10/
Top 10%10
3219 O St. Nw
Washington, DC 20007
(202) 282-0170
Washington, DC 20007
(202) 282-0170
Grades: PK-5
| 396 students
Rank: #1313.
Shepherd Elementary School
(Math: 45-49% | Reading: 65-69%)
Rank:
Rank:
10/
Top 10%10
7800 14th St Nw
Washington, DC 20012
(202) 576-6140
Washington, DC 20012
(202) 576-6140
Grades: PK-5
| 363 students
Rank: #1414.
Oyster-adams Bilingual School
(Math: 53% | Reading: 65%)
Rank:
Rank:
10/
Top 10%10
2801 Calvert St. Nw And 2501 1
Washington, DC 20008
(202) 671-6130
Washington, DC 20008
(202) 671-6130
Grades: PK-8
| 781 students
Rank: #1515.
School-within-school At Goding
(Math: 55-59% | Reading: 55-59%)
Rank:
Rank:
10/
Top 10%10
920 F St. Nw
Washington, DC 20002
(202) 727-7377
Washington, DC 20002
(202) 727-7377
Grades: PK-5
| 325 students
Rank: #1616.
Ludlow-taylor Elementary School
(Math: 40-44% | Reading: 65-69%)
Rank:
Rank:
10/
Top 10%10
659 G St. Ne
Washington, DC 20002
(202) 698-3244
Washington, DC 20002
(202) 698-3244
Grades: PK-5
| 488 students
Rank: #1717.
Marie Reed Elementary School
(Math: 30-34% | Reading: 40-44%)
Rank:
Rank:
9/
Top 20%10
2201 18th St. Nw
Washington, DC 20009
(202) 673-7308
Washington, DC 20009
(202) 673-7308
Grades: PK-5
| 452 students
Rank: #18 - 1918. - 19.
Bancroft Elementary School
(Math: 28% | Reading: 47%)
Rank:
Rank:
9/
Top 20%10
1755 Newton St. Nw
Washington, DC 20010
(202) 673-7280
Washington, DC 20010
(202) 673-7280
Grades: PK-5
| 768 students
Rank: #18 - 1918. - 19.
Thomson Elementary School
(Math: 30-34% | Reading: 35-39%)
Rank:
Rank:
9/
Top 20%10
1200 L St. Nw
Washington, DC 20005
(202) 898-4660
Washington, DC 20005
(202) 898-4660
Grades: PK-5
| 253 students
Rank: #2020.
Payne Elementary School
(Math: 25-29% | Reading: 45-49%)
Rank:
Rank:
9/
Top 20%10
1445 C St. Se
Washington, DC 20003
(202) 698-3262
Washington, DC 20003
(202) 698-3262
Grades: PK-5
| 376 students
Rank: #2121.
Garrison Elementary School
(Math: 35-39% | Reading: 30-34%)
Rank:
Rank:
9/
Top 20%10
1200 S St. Nw
Washington, DC 20009
(202) 673-7263
Washington, DC 20009
(202) 673-7263
Grades: PK-5
| 389 students
Rank: #2222.
Seaton Elementary School
(Math: 30-34% | Reading: 30-34%)
Rank:
Rank:
9/
Top 20%10
1503 10th St. Nw
Washington, DC 20001
(202) 673-7215
Washington, DC 20001
(202) 673-7215
Grades: PK-5
| 377 students
Rank: #23 - 2423. - 24.
Langdon Elementary School
(Math: 25-29% | Reading: 30-34%)
Rank:
Rank:
9/
Top 20%10
1900 Evarts St. Ne
Washington, DC 20018
(202) 576-6048
Washington, DC 20018
(202) 576-6048
Grades: PK-5
| 390 students
Rank: #23 - 2423. - 24.
Lasalle-backus Elementary School
(Math: 25-29% | Reading: 30-34%)
Rank:
Rank:
9/
Top 20%10
501 Riggs Rd. Ne
Washington, DC 20011
(202) 671-6340
Washington, DC 20011
(202) 671-6340
Grades: PK-5
| 261 students
Rank: #2525.
Burroughs Elementary School
(Math: 20-24% | Reading: 40-44%)
Rank:
Rank:
8/
Top 30%10
1820 Monroe St. Ne
Washington, DC 20018
(202) 576-6150
Washington, DC 20018
(202) 576-6150
Grades: PK-5
| 297 students
Rank: #2626.
Bruce-monroe Es At Park View
(Math: 30-34% | Reading: 25-29%)
Rank:
Rank:
8/
Top 30%10
3560 Warder St. Nw
Washington, DC 20010
(202) 576-6222
Washington, DC 20010
(202) 576-6222
Grades: PK-5
| 436 students
Rank: #2727.
Dorothy I. Height Elementary School
(Math: 25-29% | Reading: 25-29%)
Rank:
Rank:
8/
Top 30%10
4300 13th St. Nw
Washington, DC 20011
(202) 723-4100
Washington, DC 20011
(202) 723-4100
Grades: PK-5
| 396 students
Rank: #2828.
Barnard Elementary School
(Math: 24% | Reading: 31%)
Rank:
Rank:
8/
Top 30%10
430 Decatur St. Nw
Washington, DC 20011
(202) 576-1100
Washington, DC 20011
(202) 576-1100
Grades: PK-5
| 591 students
Rank: #29 - 3029. - 30.
Capitol Hill Montessori School At Logan
(Math: 15-19% | Reading: 35-39%)
Rank:
Rank:
8/
Top 30%10
215 G St Ne
Washington, DC 20002
(202) 698-4467
Washington, DC 20002
(202) 698-4467
Grades: PK-8
| 488 students
Rank: #29 - 3029. - 30.
Van Ness Elementary School
(Math: 15-19% | Reading: 35-39%)
Rank:
Rank:
8/
Top 30%10
1150 5th St Se
Washington, DC 20003
(202) 727-4314
Washington, DC 20003
(202) 727-4314
Grades: PK-5
| 392 students
Rank: #31 - 3231. - 32.
Cleveland Elementary School
(Math: 20-24% | Reading: 25-29%)
Rank:
Rank:
8/
Top 30%10
1825 8th St. Nw
Washington, DC 20001
(202) 939-4380
Washington, DC 20001
(202) 939-4380
Grades: PK-5
| 299 students
Rank: #31 - 3231. - 32.
John Lewis Elementary School
(Math: 20-24% | Reading: 25-29%)
Rank:
Rank:
8/
Top 30%10
1335 Farragut St Nw
Washington, DC 20011
(202) 576-6226
Washington, DC 20011
(202) 576-6226
Grades: PK-5
| 493 students
Rank: #3333.
Tyler Elementary School
(Math: 15-19% | Reading: 30-34%)
Rank:
Rank:
8/
Top 30%10
1001 G St. Se
Washington, DC 20003
(202) 939-4810
Washington, DC 20003
(202) 939-4810
Grades: PK-5
| 565 students
Rank: #3434.
Powell Elementary School
(Math: 15-19% | Reading: 25-29%)
Rank:
Rank:
7/
Top 50%10
1350 Upshur St. Nw
Washington, DC 20011
(202) 671-6270
Washington, DC 20011
(202) 671-6270
Grades: PK-5
| 497 students
Rank: #3535.
Whittier Elementary School
(Math: 20-24% | Reading: 20-24%)
Rank:
Rank:
7/
Top 50%10
6201 5th St. Nw
Washington, DC 20011
(202) 576-6156
Washington, DC 20011
(202) 576-6156
Grades: PK-5
| 413 students
Show 44 more public schools in District Of Columbia School District (out of 79 total schools)
Loading...
Recent Articles

Year-Round Or Traditional Schedule?
Which is more appropriate for your child? A year-round attendance schedule or traditional schedule? We look at the pros and cons.

Why You Should Encourage Your Child to Join a Sports Team
Participating in team sports has a great many benefits for children, there is no doubt. In this article you will learn what those benefits are.

White Students are Now the Minority in U.S. Public Schools
Increasing birth rates among immigrant families from Asia and Central and South America, combined with lower birth rates among white families, means that for the first time in history, public school students in the United States are majority-minority. This shift in demographics poses difficulties for schools as they work to accommodate children of varying language abilities and socio-economic backgrounds.


