Top Rankings
Anne Arundel County School District ranks among the top 20% of public school district in Maryland for:
Category
Attribute
Diversity
Most diverse schools (Top 1%)
Community Size
Largest student body (number of students) (Top 1%)
For the 2025 school year, there are 24 public high schools serving 27,126 students in Anne Arundel County School District. This district's average high testing ranking is 8/10, which is in the top 30% of public high schools in Maryland.
Public High Schools in Anne Arundel County School District have an average math proficiency score of 34% (versus the Maryland public high school average of 32%), and reading proficiency score of 56% (versus the 56% statewide average).
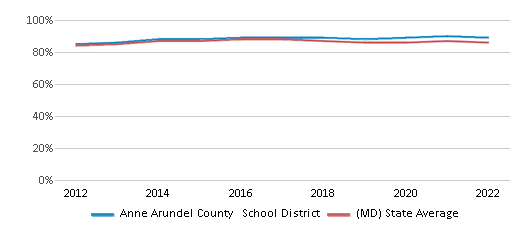
Public High School in Anne Arundel County School District have a Graduation Rate of 89%, which is more than the Maryland average of 87%.
The school with highest graduation rate is Severna Park High School, with 98% graduation rate. Read more about public school graduation rate statistics in Maryland or national school graduation rate statistics.
Minority enrollment is 55% of the student body (majority Black and Hispanic), which is less than the Maryland public high school average of 68% (majority Black).
Overview
This School District
This State (MD)
# Schools
126 Schools
287 Schools
# Students
84,346 Students
285,722 Students
# Teachers
6,038 Teachers
18,478 Teachers
Student : Teacher Ratio
14:1
14:1
District Rank
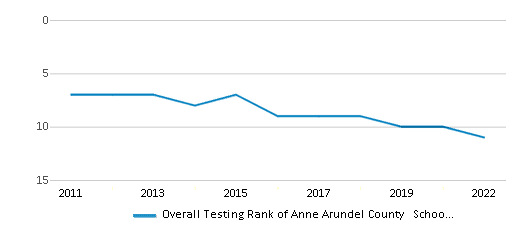
Anne Arundel County School District, which is ranked within the top 50% of all 25 school districts in Maryland (based off of combined math and reading proficiency testing data) for the 2021-2022 school year.
The school district's graduation rate of 89% has stayed relatively flat over five school years.
Overall District Rank
#11 out of 25 school districts
(Top 50%)
(Top 50%)
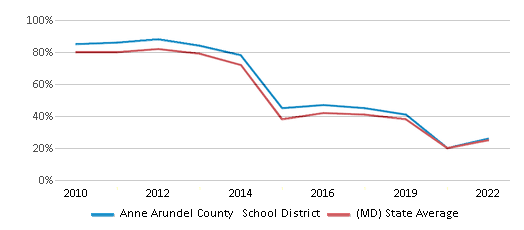
Math Test Scores (% Proficient)
26%
25%
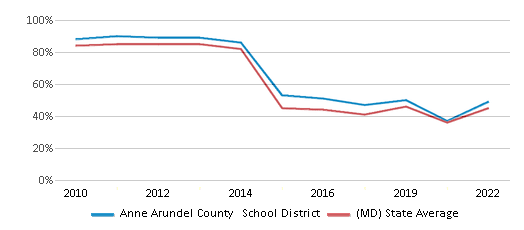
Reading/Language Arts Test Scores (% Proficient)
49%
45%
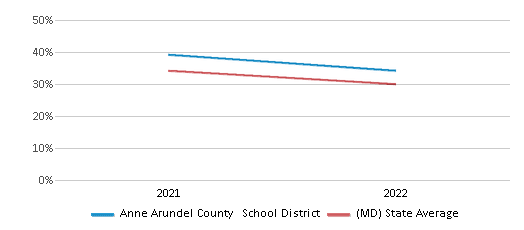
Science Test Scores (% Proficient)
41%
36%
Graduation Rate
89%
86%
Students by Ethnicity:
Diversity Score
0.70
0.73
# American Indian Students
229 Students
755 Students
% American Indian Students
n/a
n/a
# Asian Students
3,381 Students
19,388 Students
% Asian Students
4%
7%
# Hispanic Students
17,922 Students
62,415 Students
% Hispanic Students
21%
22%
# Black Students
18,781 Students
97,212 Students
% Black Students
22%
34%
# White Students
38,433 Students
92,053 Students
% White Students
46%
32%
# Hawaiian Students
123 Students
432 Students
% Hawaiian Students
n/a
n/a
# Two or more races Students
5,411 Students
13,026 Students
% of Two or more races Students
7%
5%
Students by Grade:
# Students in PK Grade:
2,504
220
# Students in K Grade:
5,851
395
# Students in 1st Grade:
6,096
429
# Students in 2nd Grade:
6,405
384
# Students in 3rd Grade:
6,171
412
# Students in 4th Grade:
6,334
461
# Students in 5th Grade:
6,191
426
# Students in 6th Grade:
6,281
1,462
# Students in 7th Grade:
6,229
1,489
# Students in 8th Grade:
6,446
1,726
# Students in 9th Grade:
7,160
79,802
# Students in 10th Grade:
6,799
72,380
# Students in 11th Grade:
6,248
64,963
# Students in 12th Grade:
5,631
61,173
# Ungraded Students:
-
-
District Revenue and Spending
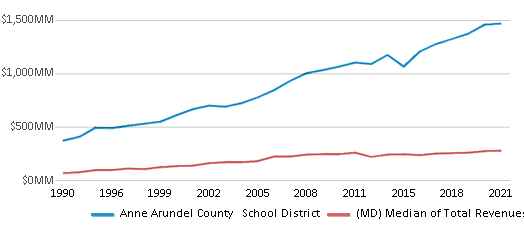
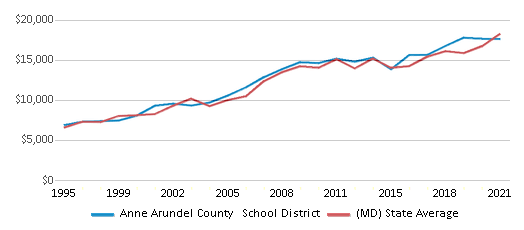
The revenue/student of $17,419 in this school district is less than the state median of $19,554. The school district revenue/student has stayed relatively flat over four school years.
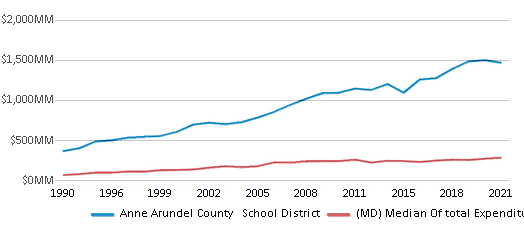
The school district's spending/student of $17,375 is less than the state median of $18,481. The school district spending/student has stayed relatively flat over four school years.
Total Revenue
$1,469 MM
$17,412 MM
Spending
$1,466 MM
$16,456 MM
Revenue / Student
$17,419
$19,554
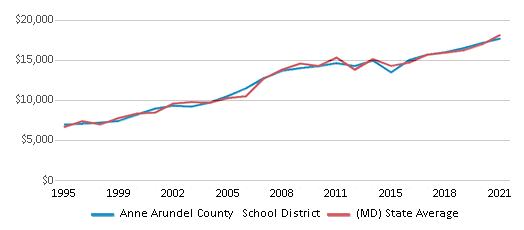
Spending / Student
$17,375
$18,481
Best Anne Arundel County School District Public High Schools (2025)
School
(Math and Reading Proficiency)
(Math and Reading Proficiency)
Location
Grades
Students
Rank: #11.
Severna Park High School
(Math: 74% | Reading: 76%)
Rank:
Rank:
10/
Top 5%10
60 Robinson Rd
Severna Park, MD 21146
(410) 544-0900
Severna Park, MD 21146
(410) 544-0900
Grades: 9-12
| 1,817 students
Rank: #22.
Broadneck High School
Magnet School
(Math: 58% | Reading: 78%)
Rank:
Rank:
10/
Top 10%10
1265 Green Holly Dr
Annapolis, MD 21409
(410) 757-1300
Annapolis, MD 21409
(410) 757-1300
Grades: 9-12
| 2,172 students
Rank: #33.
South River High School
Magnet School
(Math: 60% | Reading: 66%)
Rank:
Rank:
9/
Top 20%10
201 Central Ave E
Edgewater, MD 21037
(410) 956-5600
Edgewater, MD 21037
(410) 956-5600
Grades: 9-12
| 1,634 students
Rank: #44.
Chesapeake Science Point
Charter School
(Math: 41% | Reading: 78%)
Rank:
Rank:
9/
Top 20%10
7321 Parkway Drive South
Hanover, MD 21076
(443) 757-5277
Hanover, MD 21076
(443) 757-5277
Grades: K-12
| 889 students
Rank: #55.
Crofton High School
(Math: 45% | Reading: 71%)
Rank:
Rank:
9/
Top 20%10
2291 Davidsonville Road
Gambrills, MD 21054
(410) 451-5300
Gambrills, MD 21054
(410) 451-5300
Grades: 9-12
| 1,896 students
Rank: #66.
Chesapeake High School
(Math: 37% | Reading: 63%)
Rank:
Rank:
8/
Top 30%10
4798 Mountain Rd
Pasadena, MD 21122
(410) 255-9600
Pasadena, MD 21122
(410) 255-9600
Grades: 9-12
| 1,427 students
Rank: #77.
Arundel High School
(Math: 33% | Reading: 62%)
Rank:
Rank:
8/
Top 30%10
1001 Annapolis Rd
Gambrills, MD 21054
(410) 674-6500
Gambrills, MD 21054
(410) 674-6500
Grades: 9-12
| 1,646 students
Rank: #88.
Southern High School
(Math: 30-34% | Reading: 58%)
Rank:
Rank:
8/
Top 30%10
4400 Solomons Island Rd
Harwood, MD 20776
(410) 867-7100
Harwood, MD 20776
(410) 867-7100
Grades: 9-12
| 1,073 students
Rank: #99.
Old Mill High School
Magnet School
(Math: 23% | Reading: 54%)
Rank:
Rank:
7/
Top 50%10
600 Patriot Ln
Millersville, MD 21108
(410) 969-9010
Millersville, MD 21108
(410) 969-9010
Grades: 9-12
| 2,489 students
Rank: #1010.
Northeast High School
(Math: 26% | Reading: 50%)
Rank:
Rank:
6/
Top 50%10
1121 Duvall Hwy
Pasadena, MD 21122
(410) 437-6400
Pasadena, MD 21122
(410) 437-6400
Grades: 9-12
| 1,366 students
Rank: #1111.
Annapolis High School
Magnet School
(Math: 27% | Reading: 46%)
Rank:
Rank:
6/
Top 50%10
2700 Riva Rd
Annapolis, MD 21401
(410) 266-5240
Annapolis, MD 21401
(410) 266-5240
Grades: 9-12
| 2,089 students
Rank: #1212.
North County High School
Magnet School
(Math: 25% | Reading: 45%)
Rank:
Rank:
6/
Top 50%10
10 East 1st Avenue
Glen Burnie, MD 21061
(410) 222-6970
Glen Burnie, MD 21061
(410) 222-6970
Grades: 9-12
| 2,507 students
Rank: #1313.
Meade High School
Magnet School
(Math: 17% | Reading: 43%)
Rank:
Rank:
5/
Bottom 50%10
1100 Clark Road
Fort George G Meade, MD 20755
(410) 674-7710
Fort George G Meade, MD 20755
(410) 674-7710
Grades: 9-12
| 2,349 students
Rank: #1414.
Glen Burnie High School
Magnet School
(Math: 14% | Reading: 46%)
Rank:
Rank:
5/
Bottom 50%10
7550 Baltimore Annapolis Blvd
Glen Burnie, MD 21060
(410) 761-8950
Glen Burnie, MD 21060
(410) 761-8950
Grades: 9-12
| 2,391 students
Rank: #1515.
Anne Arundel Evening High School
Alternative School
(Math: ≤20% | Reading: 21-39%)
Rank:
Rank:
4/
Bottom 50%10
60 Robinson Road
Severna Park, MD 21146
(410) 544-0182
Severna Park, MD 21146
(410) 544-0182
Grades: 9-12
| 303 students
Rank: #1616.
Aacps Virtual Academy
Alternative School
(Math: 10% | Reading: 40%)
Rank:
Rank:
4/
Bottom 50%10
241 Peninsula Farm Road
Arnold, MD 21012
(410) 544-1082
Arnold, MD 21012
(410) 544-1082
Grades: 3-12
| 427 students
Rank: #1717.
Mary Moss At Adams Academy
Alternative School
(Math: ≤20% | Reading: ≤20%)
Rank:
Rank:
3/
Bottom 50%10
245 Clay Street
Annapolis, MD 21401
(410) 222-1639
Annapolis, MD 21401
(410) 222-1639
Grades: 6-9
| 42 students
Rank: #18 - 1918. - 19.
Central Special School
Special Education School
(Math: ≤10% | Reading: ≤10%)
Rank:
Rank:
2/
Bottom 50%10
140 Stepney Ln
Edgewater, MD 21037
(410) 956-5885
Edgewater, MD 21037
(410) 956-5885
Grades: PK-12
| 127 students
Rank: #18 - 1918. - 19.
Marley Glen School
Special Education School
(Math: ≤10% | Reading: ≤10%)
Rank:
Rank:
2/
Bottom 50%10
200 Scott Ave
Glen Burnie, MD 21060
(443) 572-0080
Glen Burnie, MD 21060
(443) 572-0080
Grades: PK-12
| 116 students
Rank: #2020.
Phoenix Academy
Special Education School
(Math: ≤5% | Reading: 6-9%)
Rank:
Rank:
1/
Bottom 50%10
1411 Cedar Park Road
Annapolis, MD 21401
(410) 222-1650
Annapolis, MD 21401
(410) 222-1650
Grades: 2-12
| 216 students
Rank: #2121.
Ruth Parker Eason School
Special Education School
(Math: ≤5% | Reading: ≤5%)
Rank:
Rank:
1/
Bottom 50%10
648 Old Mill Rd
Millersville, MD 21108
(410) 222-3815
Millersville, MD 21108
(410) 222-3815
Grades: PK-12
| 150 students
Rank: n/an/a
Center Of Applied Technology-north
Vocational School
800 Stevenson Rd
Severn, MD 21144
(410) 969-3100
Severn, MD 21144
(410) 969-3100
Grades: 9-12
| n/a students
Rank: n/an/a
Center Of Applied Technology-south
Vocational School
211 Central Ave E
Edgewater, MD 21037
(410) 956-5900
Edgewater, MD 21037
(410) 956-5900
Grades: 9-12
| n/a students
Rank: n/an/a
Studio 39
Alternative School
291 Locust Avenue
Annapolis, MD 21401
(410) 280-1501
Annapolis, MD 21401
(410) 280-1501
Grades: 9-12
| n/a students
Recent Articles

What Is A Charter School?
Explore the world of charter schools in this comprehensive guide. Learn about their history, how they operate, and the pros and cons of this educational innovation. Discover key facts about charter schools, including admission policies, demographics, and funding, as well as what to look for when considering a charter school for your child.

10 Reasons Why High School Sports Benefit Students
Discover the 10 compelling reasons why high school sports are beneficial for students. This comprehensive article explores how athletics enhance academic performance, foster personal growth, and develop crucial life skills. From improved fitness and time management to leadership development and community representation, learn why participating in high school sports can be a game-changer for students' overall success and well-being.

February 05, 2025
Understanding the U.S. Department of Education: Structure, Impact, and EvolutionWe explore how the Department of Education shapes American education, from its cabinet-level leadership to its impact on millions of students, written for general audiences seeking clarity on this vital institution.


