Top Rankings
Boston School District ranks among the top 20% of public school district in Massachusetts for:
Category
Attribute
Diversity
Most diverse schools (Top 1%)
Community Size
Largest student body (number of students) (Top 1%)
Student Attention
Lowest student:teacher ratio (Top 1%)
For the 2025 school year, there are 87 public elementary schools serving 31,053 students in Boston School District. This district's average elementary testing ranking is 2/10, which is in the bottom 50% of public elementary schools in Massachusetts.
Public Elementary Schools in Boston School District have an average math proficiency score of 22% (versus the Massachusetts public elementary school average of 40%), and reading proficiency score of 26% (versus the 42% statewide average).
Minority enrollment is 85% of the student body (majority Hispanic), which is more than the Massachusetts public elementary school average of 49% (majority Hispanic).
Overview
This School District
This State (MA)
# Schools
112 Schools
1,360 Schools
# Students
46,432 Students
605,604 Students
# Teachers
4,484 Teachers
51,596 Teachers
Student : Teacher Ratio
10:1
10:1
District Rank
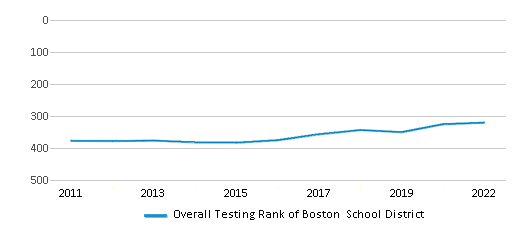
Boston School District, which is ranked within the bottom 50% of all 393 school districts in Massachusetts (based off of combined math and reading proficiency testing data) for the 2021-2022 school year.
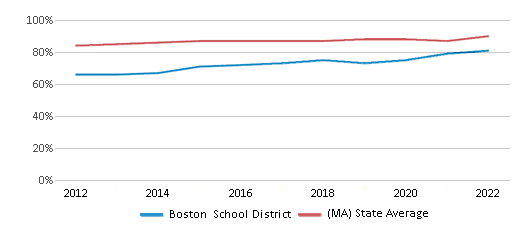
The school district's graduation rate of 81% has increased from 73% over five school years.
Overall District Rank
#320 out of 397 school districts
(Bottom 50%)
(Bottom 50%)
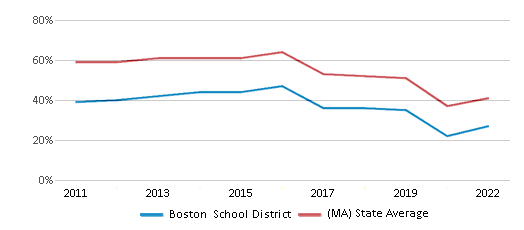
Math Test Scores (% Proficient)
27%
41%
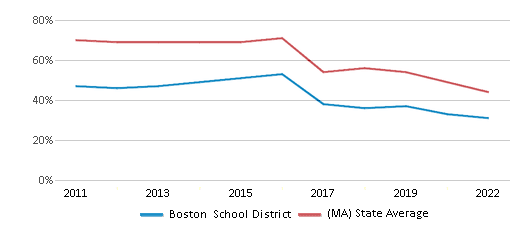
Reading/Language Arts Test Scores (% Proficient)
31%
44%
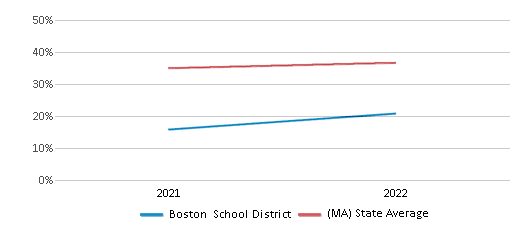
Science Test Scores (% Proficient)
25%
44%
Graduation Rate
81%
90%
Students by Ethnicity:
Diversity Score
0.70
0.66
# American Indian Students
111 Students
1,446 Students
% American Indian Students
n/a
n/a
# Asian Students
3,837 Students
44,247 Students
% Asian Students
8%
8%
# Hispanic Students
20,791 Students
157,705 Students
% Hispanic Students
45%
26%
# Black Students
13,142 Students
61,567 Students
% Black Students
28%
10%
# White Students
6,781 Students
310,647 Students
% White Students
15%
51%
# Hawaiian Students
62 Students
511 Students
% Hawaiian Students
n/a
n/a
# Two or more races Students
1,653 Students
29,006 Students
% of Two or more races Students
4%
5%
Students by Grade:
# Students in PK Grade:
2,974
20,531
# Students in K Grade:
3,324
58,912
# Students in 1st Grade:
3,477
64,458
# Students in 2nd Grade:
3,320
66,664
# Students in 3rd Grade:
3,178
64,731
# Students in 4th Grade:
3,285
65,978
# Students in 5th Grade:
3,176
67,142
# Students in 6th Grade:
3,003
67,086
# Students in 7th Grade:
3,013
56,371
# Students in 8th Grade:
3,113
53,443
# Students in 9th Grade:
3,483
5,579
# Students in 10th Grade:
3,596
5,198
# Students in 11th Grade:
3,764
4,867
# Students in 12th Grade:
3,483
4,504
# Ungraded Students:
243
140
District Revenue and Spending
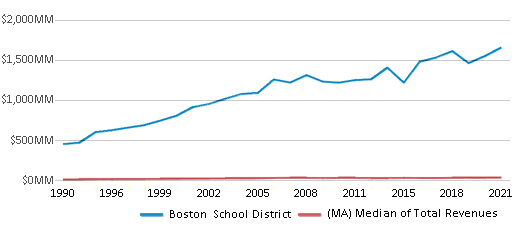
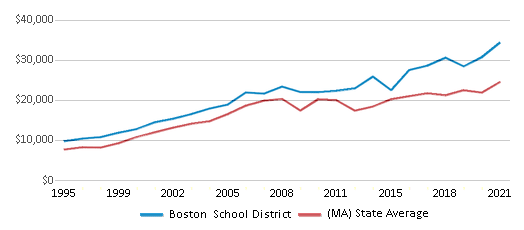
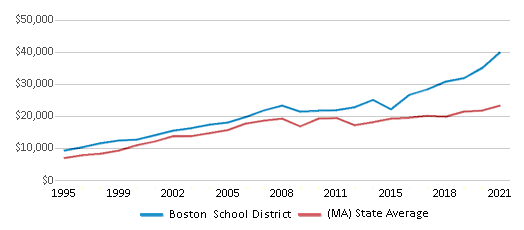
The revenue/student of $35,636 is higher than the state median of $23,845. The school district revenue/student has stayed relatively flat over four school years.
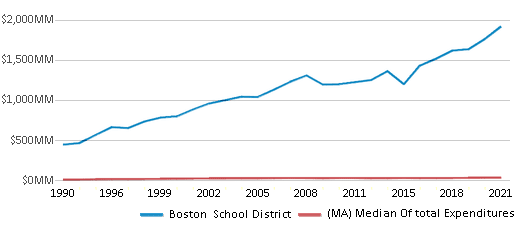
The school district's spending/student of $41,330 is higher than the state median of $24,602. The school district spending/student has stayed relatively flat over four school years.
Total Revenue
$1,655 MM
$21,850 MM
Spending
$1,919 MM
$22,544 MM
Revenue / Student
$35,636
$23,845
Spending / Student
$41,330
$24,602
Best Boston School District Public Elementary Schools (2025)
School
(Math and Reading Proficiency)
(Math and Reading Proficiency)
Location
Grades
Students
Rank: #11.
Eliot K-8 Innovation School
(Math: 70% | Reading: 67%)
Rank:
Rank:
9/
Top 20%10
16 Charter Street
Boston, MA 02113
(617) 635-8545
Boston, MA 02113
(617) 635-8545
Grades: PK-8
| 792 students
Rank: #22.
Manning Elementary School
(Math: 55-59% | Reading: 70-74%)
Rank:
Rank:
9/
Top 20%10
130 Louders Lane
Jamaica Plain, MA 02130
(617) 635-8102
Jamaica Plain, MA 02130
(617) 635-8102
Grades: PK-6
| 169 students
Rank: #33.
Warren-prescott K-8 School
(Math: 47% | Reading: 58%)
Rank:
Rank:
7/
Top 50%10
50 School Street
Charlestown, MA 02129
(617) 635-8346
Charlestown, MA 02129
(617) 635-8346
Grades: PK-8
| 499 students
Rank: #44.
Winship Elementary School
(Math: 55-59% | Reading: 45-49%)
Rank:
Rank:
7/
Top 50%10
54 Dighton Street
Brighton, MA 02135
(617) 635-8399
Brighton, MA 02135
(617) 635-8399
Grades: PK-6
| 345 students
Rank: #55.
Bradley Elementary School
(Math: 45-49% | Reading: 50-54%)
Rank:
Rank:
7/
Top 50%10
110 Beachview Road
East Boston, MA 02128
(617) 635-8422
East Boston, MA 02128
(617) 635-8422
Grades: PK-6
| 300 students
Rank: #66.
Quincy Elementary School
(Math: 54% | Reading: 42%)
Rank:
Rank:
6/
Top 50%10
885 Washington Street
Boston, MA 02111
(617) 635-8497
Boston, MA 02111
(617) 635-8497
Grades: PK-5
| 733 students
Rank: #77.
Hale Elementary School
(Math: 40-44% | Reading: 50-54%)
Rank:
Rank:
6/
Top 50%10
51 Cedar Street
Roxbury, MA 02119
(617) 635-8205
Roxbury, MA 02119
(617) 635-8205
Grades: PK-6
| 166 students
Rank: #88.
Mendell Elementary School
(Math: 40-44% | Reading: 45-49%)
Rank:
Rank:
6/
Top 50%10
164 School Street
Roxbury, MA 02119
(617) 635-8234
Roxbury, MA 02119
(617) 635-8234
Grades: PK-6
| 308 students
Rank: #99.
Kilmer K-8 School
(Math: 48% | Reading: 42%)
Rank:
Rank:
6/
Top 50%10
35 Baker Street
West Roxbury, MA 02132
(617) 635-8060
West Roxbury, MA 02132
(617) 635-8060
Grades: PK-8
| 371 students
Rank: #1010.
Mozart Elementary School
(Math: 45-49% | Reading: 40-44%)
Rank:
Rank:
6/
Top 50%10
236 Beech Street
Roslindale, MA 02131
(617) 635-8082
Roslindale, MA 02131
(617) 635-8082
Grades: PK-6
| 178 students
Rank: #1111.
Henderson K-12 Inclusion School Lower
(Math: 70-79% | Reading: 60-69% )
Rank:
Rank:
6/
Top 50%10
1669 Dorchester Avenue
Dorchester, MA 02122
(617) 635-8725
Dorchester, MA 02122
(617) 635-8725
Grades: PK-1
| 218 students
Rank: #1212.
Murphy K-8 School
(Math: 41% | Reading: 42%)
Rank:
Rank:
5/
Bottom 50%10
1 Worrell Street
Dorchester, MA 02122
(617) 635-8781
Dorchester, MA 02122
(617) 635-8781
Grades: PK-8
| 839 students
Rank: #1313.
Harvard-kent Elementary School
(Math: 40-44% | Reading: 35-39%)
Rank:
Rank:
5/
Bottom 50%10
50 Bunker Hill Street
Charlestown, MA 02129
(617) 635-8358
Charlestown, MA 02129
(617) 635-8358
Grades: PK-6
| 340 students
Rank: #1414.
Lyndon K-8 School
(Math: 34% | Reading: 46%)
Rank:
Rank:
5/
Bottom 50%10
20 Mt. Vernon Street
West Roxbury, MA 02132
(617) 635-6824
West Roxbury, MA 02132
(617) 635-6824
Grades: PK-8
| 528 students
Rank: #1515.
Beethoven Elementary School
(Math: <50% | Reading: <50% )
Rank:
Rank:
4/
Bottom 50%10
5125 Washington Street
West Roxbury, MA 02132
(617) 635-8149
West Roxbury, MA 02132
(617) 635-8149
Grades: PK-2
| 262 students
Rank: #16 - 1716. - 17.
Bates Elementary School
(Math: 35-39% | Reading: 30-34%)
Rank:
Rank:
4/
Bottom 50%10
426 Beech Street
Roslindale, MA 02131
(617) 635-8064
Roslindale, MA 02131
(617) 635-8064
Grades: PK-6
| 279 students
Rank: #16 - 1716. - 17.
Otis Elementary School
(Math: 35-39% | Reading: 30-34%)
Rank:
Rank:
4/
Bottom 50%10
218 Marion Street
East Boston, MA 02128
(617) 635-8372
East Boston, MA 02128
(617) 635-8372
Grades: PK-6
| 402 students
Rank: #1818.
Everett Elementary School
(Math: 30-34% | Reading: 35-39%)
Rank:
Rank:
4/
Bottom 50%10
71 Pleasant Street
Dorchester, MA 02125
(617) 635-8778
Dorchester, MA 02125
(617) 635-8778
Grades: PK-6
| 278 students
Rank: #1919.
Philbrick Elementary School
(Math: 30-39% | Reading: 30-39%)
Rank:
Rank:
4/
Bottom 50%10
40 Philbrick Street
Roslindale, MA 02131
(617) 635-8069
Roslindale, MA 02131
(617) 635-8069
Grades: PK-6
| 132 students
Rank: #2020.
Ohrenberger School
(Math: 32% | Reading: 34%)
Rank:
Rank:
4/
Bottom 50%10
175 W Boundary Road
West Roxbury, MA 02132
(617) 635-8157
West Roxbury, MA 02132
(617) 635-8157
Grades: 3-8
| 448 students
Rank: #21 - 2321. - 23.
Boston Teachers Union K-8 Pilot
(Math: 25-29% | Reading: 35-39%)
Rank:
Rank:
4/
Bottom 50%10
25 Walk Hill Street
Jamaica Plain, MA 02130
(617) 635-7717
Jamaica Plain, MA 02130
(617) 635-7717
Grades: PK-8
| 272 students
Rank: #21 - 2321. - 23.
Hurley K-8 School
(Math: 25-29% | Reading: 35-39%)
Rank:
Rank:
4/
Bottom 50%10
70 Worcester Street
Boston, MA 02118
(617) 635-8489
Boston, MA 02118
(617) 635-8489
Grades: PK-8
| 349 students
Rank: #21 - 2321. - 23.
Sumner Elementary School
(Math: 25-29% | Reading: 35-39%)
Rank:
Rank:
4/
Bottom 50%10
15 Basile Street
Roslindale, MA 02131
(617) 635-8131
Roslindale, MA 02131
(617) 635-8131
Grades: PK-6
| 580 students
Rank: #2424.
Quincy Upper School
(Math: 36% | Reading: 27%)
Rank:
Rank:
3/
Bottom 50%10
152 Arlington Street
Boston, MA 02116
(617) 635-8940
Boston, MA 02116
(617) 635-8940
Grades: 6-12
| 532 students
Rank: #2525.
Lyon K-8 School
(Math: 30-34% | Reading: 25-29%)
Rank:
Rank:
3/
Bottom 50%10
50 Beechcroft Street
Brighton, MA 02135
(617) 635-7945
Brighton, MA 02135
(617) 635-7945
Grades: K-8
| 120 students
Rank: #2626.
Lee Academy
(Math: 21-39% | Reading: 21-39%)
Rank:
Rank:
3/
Bottom 50%10
25 Dunbar Avenue
Dorchester Center, MA 02124
(617) 635-8618
Dorchester Center, MA 02124
(617) 635-8618
Grades: PK-3
| 200 students
Rank: #2727.
Alighieri Dante Montessori School
(Math: 20-29% | Reading: 30-39%)
Rank:
Rank:
3/
Bottom 50%10
37 Gove Street
East Boston, MA 02128
(617) 635-8529
East Boston, MA 02128
(617) 635-8529
Grades: PK-6
| 108 students
Rank: #2828.
Curley K-8 School
(Math: 24% | Reading: 32%)
Rank:
Rank:
3/
Bottom 50%10
493 Centre St.
Jamaica Plain, MA 02130
(617) 635-8176
Jamaica Plain, MA 02130
(617) 635-8176
Grades: PK-8
| 912 students
Rank: #2929.
Perry Elementary School
(Math: 25-29% | Reading: 25-29%)
Rank:
Rank:
3/
Bottom 50%10
745 E. 7th Street
South Boston, MA 02127
(617) 635-8840
South Boston, MA 02127
(617) 635-8840
Grades: PK-6
| 181 students
Rank: #30 - 3230. - 32.
Adams Elementary School
(Math: 20-24% | Reading: 30-34%)
Rank:
Rank:
3/
Bottom 50%10
165 Webster Street
East Boston, MA 02128
(617) 635-8383
East Boston, MA 02128
(617) 635-8383
Grades: PK-6
| 251 students
Rank: #30 - 3230. - 32.
Grew Elementary School
(Math: 20-24% | Reading: 30-34%)
Rank:
Rank:
3/
Bottom 50%10
40 Gordon Avenue
Hyde Park, MA 02136
(617) 635-8715
Hyde Park, MA 02136
(617) 635-8715
Grades: PK-6
| 197 students
Rank: #30 - 3230. - 32.
Russell Elementary School
(Math: 20-24% | Reading: 30-34%)
Rank:
Rank:
3/
Bottom 50%10
750 Columbia Road
Dorchester, MA 02125
(617) 635-8803
Dorchester, MA 02125
(617) 635-8803
Grades: PK-5
| 346 students
Rank: #3333.
Gardner Pilot Academy
(Math: 26% | Reading: 30%)
Rank:
Rank:
3/
Bottom 50%10
30 Athol Street
Allston, MA 02134
(617) 635-8365
Allston, MA 02134
(617) 635-8365
Grades: PK-8
| 371 students
Rank: #3434.
East Boston Early Education Center
(Math: ≥50% | Reading: ≥50% )
Rank:
Rank:
3/
Bottom 50%10
135 Grove Street
East Boston, MA 02128
(617) 635-6456
East Boston, MA 02128
(617) 635-6456
Grades: PK-1
| 196 students
Rank: #3535.
Haley Pilot School
(Math: 24% | Reading: 27%)
Rank:
Rank:
3/
Bottom 50%10
570 American Legion Hwy
Roslindale, MA 02131
(617) 635-8169
Roslindale, MA 02131
(617) 635-8169
Grades: PK-8
| 381 students
Show 52 more public schools in Boston School District (out of 87 total schools)
Loading...
Recent Articles

What Is A Charter School?
Explore the world of charter schools in this comprehensive guide. Learn about their history, how they operate, and the pros and cons of this educational innovation. Discover key facts about charter schools, including admission policies, demographics, and funding, as well as what to look for when considering a charter school for your child.

10 Reasons Why High School Sports Benefit Students
Discover the 10 compelling reasons why high school sports are beneficial for students. This comprehensive article explores how athletics enhance academic performance, foster personal growth, and develop crucial life skills. From improved fitness and time management to leadership development and community representation, learn why participating in high school sports can be a game-changer for students' overall success and well-being.

February 05, 2025
Understanding the U.S. Department of Education: Structure, Impact, and EvolutionWe explore how the Department of Education shapes American education, from its cabinet-level leadership to its impact on millions of students, written for general audiences seeking clarity on this vital institution.


