Top Rankings
Boston School District ranks among the top 20% of public school district in Massachusetts for:
Category
Attribute
Diversity
Most diverse schools (Top 1%)
Community Size
Largest student body (number of students) (Top 1%)
Student Attention
Lowest student:teacher ratio (Top 1%)
For the 2025 school year, there are 112 public schools serving 46,432 students in Boston School District. This district's average testing ranking is 3/10, which is in the bottom 50% of public schools in Massachusetts.
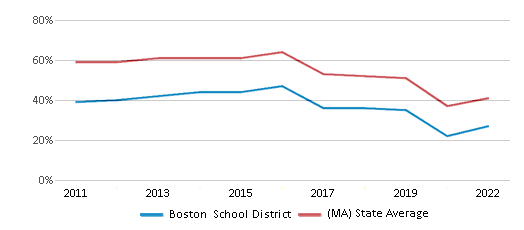
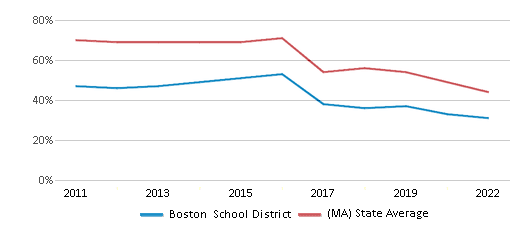
Public Schools in Boston School District have an average math proficiency score of 29% (versus the Massachusetts public school average of 42%), and reading proficiency score of 33% (versus the 45% statewide average).
Minority enrollment is 85% of the student body (majority Hispanic), which is more than the Massachusetts public school average of 47% (majority Hispanic).
Overview
This School District
This State (MA)
# Schools
112 Schools
1,837 Schools
# Students
46,432 Students
916,334 Students
# Teachers
4,484 Teachers
77,716 Teachers
Student : Teacher Ratio
10:1
10:1
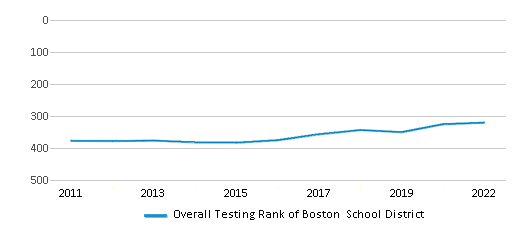
District Rank
Boston School District, which is ranked within the bottom 50% of all 393 school districts in Massachusetts (based off of combined math and reading proficiency testing data) for the 2021-2022 school year.
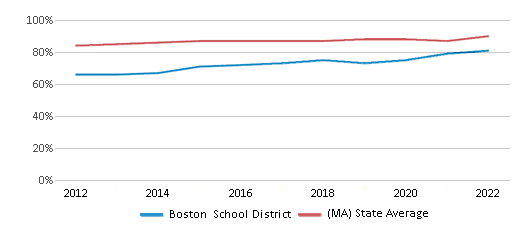
The school district's graduation rate of 81% has increased from 73% over five school years.
Overall District Rank
#320 out of 397 school districts
(Bottom 50%)
(Bottom 50%)
Math Test Scores (% Proficient)
27%
41%
Reading/Language Arts Test Scores (% Proficient)
31%
44%
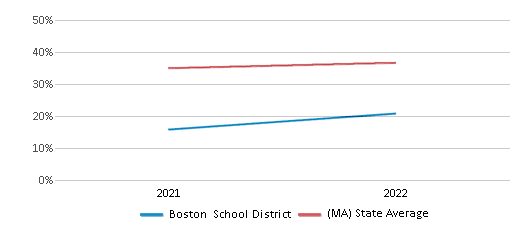
Science Test Scores (% Proficient)
25%
44%
Graduation Rate
81%
90%
Students by Ethnicity:
Diversity Score
0.70
0.65
# American Indian Students
111 Students
2,192 Students
% American Indian Students
n/a
n/a
# Asian Students
3,837 Students
67,818 Students
% Asian Students
8%
7%
# Hispanic Students
20,791 Students
230,769 Students
% Hispanic Students
45%
25%
# Black Students
13,142 Students
88,074 Students
% Black Students
28%
10%
# White Students
6,781 Students
483,656 Students
% White Students
15%
53%
# Hawaiian Students
62 Students
785 Students
% Hawaiian Students
n/a
n/a
# Two or more races Students
1,653 Students
41,339 Students
% of Two or more races Students
4%
5%
Students by Grade:
# Students in PK Grade:
2,974
32,288
# Students in K Grade:
3,324
62,105
# Students in 1st Grade:
3,477
64,458
# Students in 2nd Grade:
3,320
66,664
# Students in 3rd Grade:
3,178
64,731
# Students in 4th Grade:
3,285
65,978
# Students in 5th Grade:
3,176
67,142
# Students in 6th Grade:
3,003
67,086
# Students in 7th Grade:
3,013
68,011
# Students in 8th Grade:
3,113
68,221
# Students in 9th Grade:
3,483
73,757
# Students in 10th Grade:
3,596
73,439
# Students in 11th Grade:
3,764
71,886
# Students in 12th Grade:
3,483
68,770
# Ungraded Students:
243
1,798
District Revenue and Spending
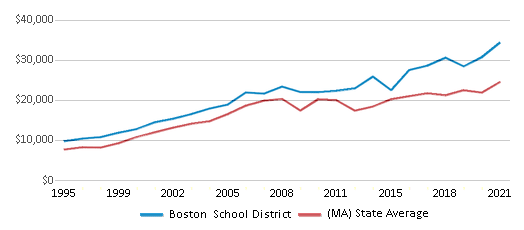
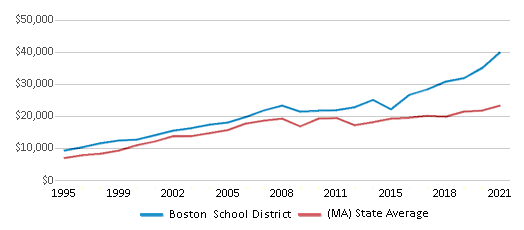
The revenue/student of $35,636 is higher than the state median of $23,845. The school district revenue/student has stayed relatively flat over four school years.
The school district's spending/student of $41,330 is higher than the state median of $24,602. The school district spending/student has stayed relatively flat over four school years.
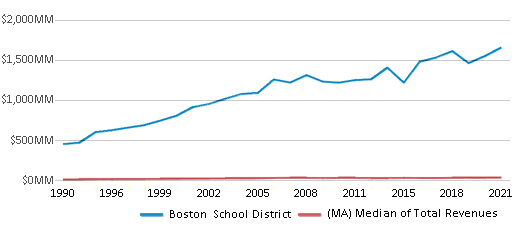
Total Revenue
$1,655 MM
$21,850 MM
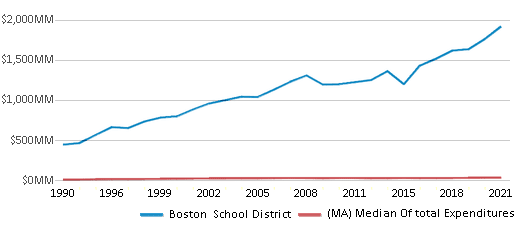
Spending
$1,919 MM
$22,544 MM
Revenue / Student
$35,636
$23,845
Spending / Student
$41,330
$24,602
Best Boston School District Public Schools (2025)
School
(Math and Reading Proficiency)
(Math and Reading Proficiency)
Location
Grades
Students
Rank: #11.
Boston Latin School
(Math: 85% | Reading: 87%)
Rank:
Rank:
10/
Top 1%10
78 Ave Louis Pasteur
Boston, MA 02115
(617) 635-8895
Boston, MA 02115
(617) 635-8895
Grades: 7-12
| 2,401 students
Rank: #22.
O'bryant School Of Math & Science
(Math: 80% | Reading: 79%)
Rank:
Rank:
10/
Top 5%10
55 Malcolm X Blvd
Roxbury Crossing, MA 02120
(617) 635-9932
Roxbury Crossing, MA 02120
(617) 635-9932
Grades: 7-12
| 1,538 students
Rank: #33.
Eliot K-8 Innovation School
(Math: 70% | Reading: 67%)
Rank:
Rank:
9/
Top 20%10
16 Charter Street
Boston, MA 02113
(617) 635-8545
Boston, MA 02113
(617) 635-8545
Grades: PK-8
| 792 students
Rank: #44.
Boston Latin Academy
(Math: 61% | Reading: 76%)
Rank:
Rank:
9/
Top 20%10
205 Townsend Street
Dorchester, MA 02121
(617) 635-9957
Dorchester, MA 02121
(617) 635-9957
Grades: 7-12
| 1,693 students
Rank: #55.
Manning Elementary School
(Math: 55-59% | Reading: 70-74%)
Rank:
Rank:
9/
Top 20%10
130 Louders Lane
Jamaica Plain, MA 02130
(617) 635-8102
Jamaica Plain, MA 02130
(617) 635-8102
Grades: PK-6
| 169 students
Rank: #66.
Warren-prescott K-8 School
(Math: 47% | Reading: 58%)
Rank:
Rank:
7/
Top 50%10
50 School Street
Charlestown, MA 02129
(617) 635-8346
Charlestown, MA 02129
(617) 635-8346
Grades: PK-8
| 499 students
Rank: #77.
Winship Elementary School
(Math: 55-59% | Reading: 45-49%)
Rank:
Rank:
7/
Top 50%10
54 Dighton Street
Brighton, MA 02135
(617) 635-8399
Brighton, MA 02135
(617) 635-8399
Grades: PK-6
| 345 students
Rank: #88.
Bradley Elementary School
(Math: 45-49% | Reading: 50-54%)
Rank:
Rank:
7/
Top 50%10
110 Beachview Road
East Boston, MA 02128
(617) 635-8422
East Boston, MA 02128
(617) 635-8422
Grades: PK-6
| 300 students
Rank: #99.
Quincy Elementary School
(Math: 54% | Reading: 42%)
Rank:
Rank:
6/
Top 50%10
885 Washington Street
Boston, MA 02111
(617) 635-8497
Boston, MA 02111
(617) 635-8497
Grades: PK-5
| 733 students
Rank: #1010.
Hale Elementary School
(Math: 40-44% | Reading: 50-54%)
Rank:
Rank:
6/
Top 50%10
51 Cedar Street
Roxbury, MA 02119
(617) 635-8205
Roxbury, MA 02119
(617) 635-8205
Grades: PK-6
| 166 students
Rank: #11 - 1211. - 12.
Fenway High School
Alternative School
(Math: 40-44% | Reading: 45-49%)
Rank:
Rank:
6/
Top 50%10
67 Alleghany St
Roxbury Crossing, MA 02120
(617) 635-9911
Roxbury Crossing, MA 02120
(617) 635-9911
Grades: 9-12
| 376 students
Rank: #11 - 1211. - 12.
Mendell Elementary School
(Math: 40-44% | Reading: 45-49%)
Rank:
Rank:
6/
Top 50%10
164 School Street
Roxbury, MA 02119
(617) 635-8234
Roxbury, MA 02119
(617) 635-8234
Grades: PK-6
| 308 students
Rank: #1313.
Kilmer K-8 School
(Math: 48% | Reading: 42%)
Rank:
Rank:
6/
Top 50%10
35 Baker Street
West Roxbury, MA 02132
(617) 635-8060
West Roxbury, MA 02132
(617) 635-8060
Grades: PK-8
| 371 students
Rank: #1414.
Mozart Elementary School
(Math: 45-49% | Reading: 40-44%)
Rank:
Rank:
6/
Top 50%10
236 Beech Street
Roslindale, MA 02131
(617) 635-8082
Roslindale, MA 02131
(617) 635-8082
Grades: PK-6
| 178 students
Rank: #1515.
Henderson K-12 Inclusion School Lower
(Math: 70-79% | Reading: 60-69% )
Rank:
Rank:
6/
Top 50%10
1669 Dorchester Avenue
Dorchester, MA 02122
(617) 635-8725
Dorchester, MA 02122
(617) 635-8725
Grades: PK-1
| 218 students
Rank: #1616.
Boston Arts Academy
Alternative School
(Math: 20-24% | Reading: 60-64%)
Rank:
Rank:
6/
Top 50%10
174 Ipswich Street
Boston, MA 02215
(617) 635-6470
Boston, MA 02215
(617) 635-6470
Grades: 9-12
| 473 students
Rank: #1717.
Murphy K-8 School
(Math: 41% | Reading: 42%)
Rank:
Rank:
5/
Bottom 50%10
1 Worrell Street
Dorchester, MA 02122
(617) 635-8781
Dorchester, MA 02122
(617) 635-8781
Grades: PK-8
| 839 students
Rank: #1818.
Harvard-kent Elementary School
(Math: 40-44% | Reading: 35-39%)
Rank:
Rank:
5/
Bottom 50%10
50 Bunker Hill Street
Charlestown, MA 02129
(617) 635-8358
Charlestown, MA 02129
(617) 635-8358
Grades: PK-6
| 340 students
Rank: #1919.
Lyndon K-8 School
(Math: 34% | Reading: 46%)
Rank:
Rank:
5/
Bottom 50%10
20 Mt. Vernon Street
West Roxbury, MA 02132
(617) 635-6824
West Roxbury, MA 02132
(617) 635-6824
Grades: PK-8
| 528 students
Rank: #20 - 2220. - 22.
Carter School
(Math: <50% | Reading: <50% )
Rank:
Rank:
5/
Bottom 50%10
270 Columbia Rd
Dorchester, MA 02121
(617) 635-9832
Dorchester, MA 02121
(617) 635-9832
Grades: 7-12
| 31 students
Rank: #20 - 2220. - 22.
Community Academy
(Math: <50% | Reading: <50% )
Rank:
Rank:
5/
Bottom 50%10
25 Glen Road
Jamaica Plain, MA 02130
(617) 635-8950
Jamaica Plain, MA 02130
(617) 635-8950
Grades: 9-12
| 41 students
Rank: #20 - 2220. - 22.
Greater Egleston High School
(Math: <50% | Reading: <50% )
Rank:
Rank:
5/
Bottom 50%10
3134 Washington Street
Roxbury, MA 02119
(617) 635-6429
Roxbury, MA 02119
(617) 635-6429
Grades: 9-12
| 76 students
Rank: #2323.
New Mission High School
Alternative School
(Math: 30% | Reading: 47%)
Rank:
Rank:
5/
Bottom 50%10
655 Metropolitan Ave
Hyde Park, MA 02136
(617) 635-6437
Hyde Park, MA 02136
(617) 635-6437
Grades: 7-12
| 668 students
Rank: #2424.
Beethoven Elementary School
(Math: <50% | Reading: <50% )
Rank:
Rank:
4/
Bottom 50%10
5125 Washington Street
West Roxbury, MA 02132
(617) 635-8149
West Roxbury, MA 02132
(617) 635-8149
Grades: PK-2
| 262 students
Rank: #25 - 2625. - 26.
Bates Elementary School
(Math: 35-39% | Reading: 30-34%)
Rank:
Rank:
4/
Bottom 50%10
426 Beech Street
Roslindale, MA 02131
(617) 635-8064
Roslindale, MA 02131
(617) 635-8064
Grades: PK-6
| 279 students
Rank: #25 - 2625. - 26.
Otis Elementary School
(Math: 35-39% | Reading: 30-34%)
Rank:
Rank:
4/
Bottom 50%10
218 Marion Street
East Boston, MA 02128
(617) 635-8372
East Boston, MA 02128
(617) 635-8372
Grades: PK-6
| 402 students
Rank: #2727.
Everett Elementary School
(Math: 30-34% | Reading: 35-39%)
Rank:
Rank:
4/
Bottom 50%10
71 Pleasant Street
Dorchester, MA 02125
(617) 635-8778
Dorchester, MA 02125
(617) 635-8778
Grades: PK-6
| 278 students
Rank: #2828.
Philbrick Elementary School
(Math: 30-39% | Reading: 30-39%)
Rank:
Rank:
4/
Bottom 50%10
40 Philbrick Street
Roslindale, MA 02131
(617) 635-8069
Roslindale, MA 02131
(617) 635-8069
Grades: PK-6
| 132 students
Rank: #2929.
Ohrenberger School
(Math: 32% | Reading: 34%)
Rank:
Rank:
4/
Bottom 50%10
175 W Boundary Road
West Roxbury, MA 02132
(617) 635-8157
West Roxbury, MA 02132
(617) 635-8157
Grades: 3-8
| 448 students
Rank: #30 - 3230. - 32.
Boston Teachers Union K-8 Pilot
(Math: 25-29% | Reading: 35-39%)
Rank:
Rank:
4/
Bottom 50%10
25 Walk Hill Street
Jamaica Plain, MA 02130
(617) 635-7717
Jamaica Plain, MA 02130
(617) 635-7717
Grades: PK-8
| 272 students
Rank: #30 - 3230. - 32.
Hurley K-8 School
(Math: 25-29% | Reading: 35-39%)
Rank:
Rank:
4/
Bottom 50%10
70 Worcester Street
Boston, MA 02118
(617) 635-8489
Boston, MA 02118
(617) 635-8489
Grades: PK-8
| 349 students
Rank: #30 - 3230. - 32.
Sumner Elementary School
(Math: 25-29% | Reading: 35-39%)
Rank:
Rank:
4/
Bottom 50%10
15 Basile Street
Roslindale, MA 02131
(617) 635-8131
Roslindale, MA 02131
(617) 635-8131
Grades: PK-6
| 580 students
Rank: #3333.
Quincy Upper School
(Math: 36% | Reading: 27%)
Rank:
Rank:
3/
Bottom 50%10
152 Arlington Street
Boston, MA 02116
(617) 635-8940
Boston, MA 02116
(617) 635-8940
Grades: 6-12
| 532 students
Rank: #3434.
Lyon K-8 School
(Math: 30-34% | Reading: 25-29%)
Rank:
Rank:
3/
Bottom 50%10
50 Beechcroft Street
Brighton, MA 02135
(617) 635-7945
Brighton, MA 02135
(617) 635-7945
Grades: K-8
| 120 students
Rank: #3535.
Lee Academy
(Math: 21-39% | Reading: 21-39%)
Rank:
Rank:
3/
Bottom 50%10
25 Dunbar Avenue
Dorchester Center, MA 02124
(617) 635-8618
Dorchester Center, MA 02124
(617) 635-8618
Grades: PK-3
| 200 students
Show 77 more public schools in Boston School District (out of 112 total schools)
Loading...
Frequently Asked Questions
How many schools belong to Boston School District?
Boston School District manages 112 public schools serving 46,432 students.
What is the rank of Boston School District?
Boston School District is ranked #311 out of 393 school districts in Massachusetts (bottom 50%) based off of combined math and reading proficiency testing data for the 2021-2022 school year. This district ranks in the top 20% of Massachusetts school districts for: Most diverse schools (Top 1%), Largest student body (number of students) (Top 1%) and Lowest student:teacher ratio (Top 1%)
What is the racial composition of students in Boston School District?
45% of Boston School District students are Hispanic, 28% of students are Black, 15% of students are White, 8% of students are Asian, and 4% of students are Two or more races.
What is the student/teacher ratio of Boston School District?
Boston School District has a student/teacher ratio of 10:1, which is lower than the Massachusetts state average of 12:1.
What is Boston School District's spending/student ratio?
The school district's spending/student of $41,330 is higher than the state median of $24,602. The school district spending/student has stayed relatively flat over four school years.
Recent Articles

Year-Round Or Traditional Schedule?
Which is more appropriate for your child? A year-round attendance schedule or traditional schedule? We look at the pros and cons.

Why You Should Encourage Your Child to Join a Sports Team
Participating in team sports has a great many benefits for children, there is no doubt. In this article you will learn what those benefits are.

White Students are Now the Minority in U.S. Public Schools
Increasing birth rates among immigrant families from Asia and Central and South America, combined with lower birth rates among white families, means that for the first time in history, public school students in the United States are majority-minority. This shift in demographics poses difficulties for schools as they work to accommodate children of varying language abilities and socio-economic backgrounds.


