Top Rankings
Boston School District ranks among the top 20% of public school district in Massachusetts for:
Category
Attribute
Diversity
Most diverse schools (Top 1%)
Community Size
Largest student body (number of students) (Top 1%)
Student Attention
Lowest student:teacher ratio (Top 1%)
For the 2025 school year, there are 31 public high schools serving 18,180 students in Boston School District. This district's average high testing ranking is 4/10, which is in the bottom 50% of public high schools in Massachusetts.
Public High Schools in Boston School District have an average math proficiency score of 42% (versus the Massachusetts public high school average of 44%), and reading proficiency score of 48% (versus the 52% statewide average).
Public High School in Boston School District have a Graduation Rate of 82%, which is less than the Massachusetts average of 90%.
The school with highest graduation rate is O'bryant School Of Math & Science, with ≥99% graduation rate. Read more about public school graduation rate statistics in Massachusetts or national school graduation rate statistics.
Minority enrollment is 88% of the student body (majority Hispanic), which is more than the Massachusetts public high school average of 48% (majority Hispanic).
Overview
This School District
This State (MA)
# Schools
112 Schools
414 Schools
# Students
46,432 Students
327,892 Students
# Teachers
4,484 Teachers
27,777 Teachers
Student : Teacher Ratio
10:1
10:1
District Rank
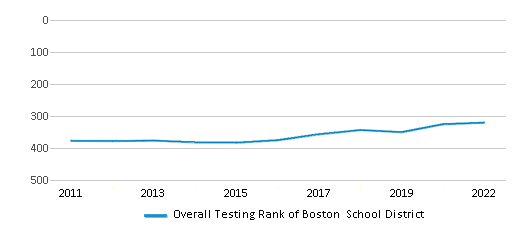
Boston School District, which is ranked within the bottom 50% of all 393 school districts in Massachusetts (based off of combined math and reading proficiency testing data) for the 2021-2022 school year.
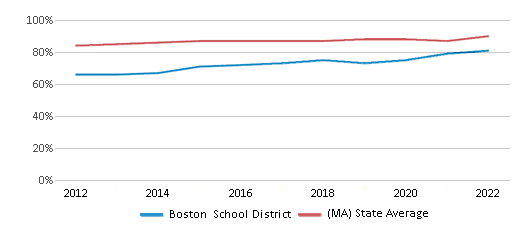
The school district's graduation rate of 81% has increased from 73% over five school years.
Overall District Rank
#320 out of 397 school districts
(Bottom 50%)
(Bottom 50%)
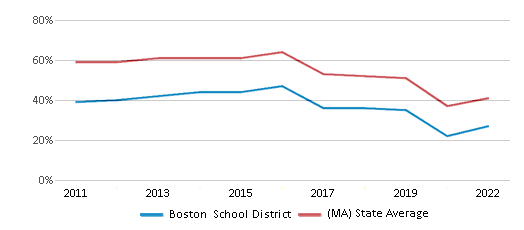
Math Test Scores (% Proficient)
27%
41%
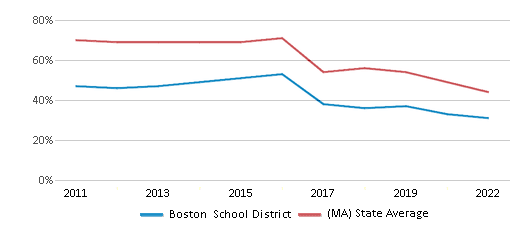
Reading/Language Arts Test Scores (% Proficient)
31%
44%
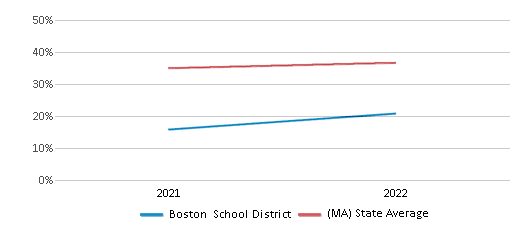
Science Test Scores (% Proficient)
25%
44%
Graduation Rate
81%
90%
Students by Ethnicity:
Diversity Score
0.70
0.66
# American Indian Students
111 Students
846 Students
% American Indian Students
n/a
n/a
# Asian Students
3,837 Students
23,209 Students
% Asian Students
8%
7%
# Hispanic Students
20,791 Students
82,718 Students
% Hispanic Students
45%
25%
# Black Students
13,142 Students
37,509 Students
% Black Students
28%
12%
# White Students
6,781 Students
168,963 Students
% White Students
15%
52%
# Hawaiian Students
62 Students
298 Students
% Hawaiian Students
n/a
n/a
# Two or more races Students
1,653 Students
13,053 Students
% of Two or more races Students
4%
4%
Students by Grade:
# Students in PK Grade:
2,974
972
# Students in K Grade:
3,324
1,564
# Students in 1st Grade:
3,477
1,660
# Students in 2nd Grade:
3,320
1,779
# Students in 3rd Grade:
3,178
1,764
# Students in 4th Grade:
3,285
1,783
# Students in 5th Grade:
3,176
2,733
# Students in 6th Grade:
3,003
5,100
# Students in 7th Grade:
3,013
8,799
# Students in 8th Grade:
3,113
12,237
# Students in 9th Grade:
3,483
73,757
# Students in 10th Grade:
3,596
73,439
# Students in 11th Grade:
3,764
71,886
# Students in 12th Grade:
3,483
68,770
# Ungraded Students:
243
1,649
District Revenue and Spending
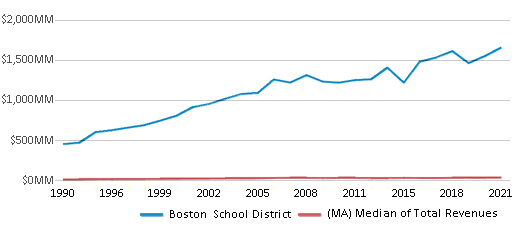
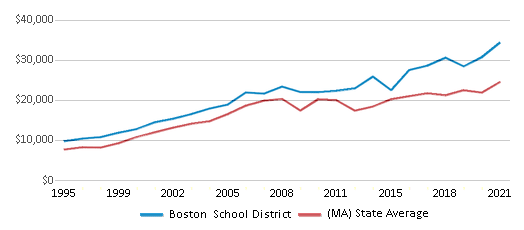
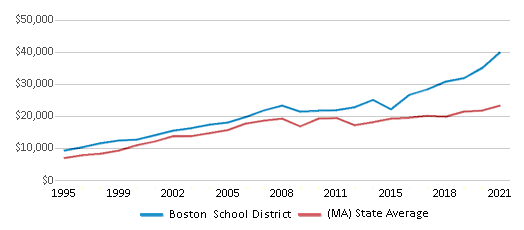
The revenue/student of $35,636 is higher than the state median of $23,845. The school district revenue/student has stayed relatively flat over four school years.
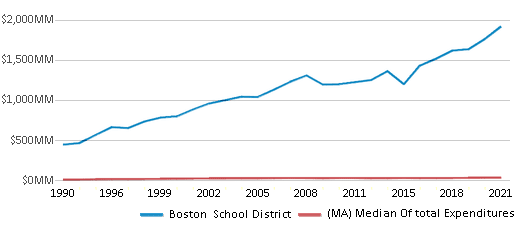
The school district's spending/student of $41,330 is higher than the state median of $24,602. The school district spending/student has stayed relatively flat over four school years.
Total Revenue
$1,655 MM
$21,850 MM
Spending
$1,919 MM
$22,544 MM
Revenue / Student
$35,636
$23,845
Spending / Student
$41,330
$24,602
Best Boston School District Public High Schools (2025)
School
(Math and Reading Proficiency)
(Math and Reading Proficiency)
Location
Grades
Students
Rank: #11.
Boston Latin School
(Math: 85% | Reading: 87%)
Rank:
Rank:
10/
Top 1%10
78 Ave Louis Pasteur
Boston, MA 02115
(617) 635-8895
Boston, MA 02115
(617) 635-8895
Grades: 7-12
| 2,401 students
Rank: #22.
O'bryant School Of Math & Science
(Math: 80% | Reading: 79%)
Rank:
Rank:
10/
Top 5%10
55 Malcolm X Blvd
Roxbury Crossing, MA 02120
(617) 635-9932
Roxbury Crossing, MA 02120
(617) 635-9932
Grades: 7-12
| 1,538 students
Rank: #33.
Boston Latin Academy
(Math: 61% | Reading: 76%)
Rank:
Rank:
9/
Top 20%10
205 Townsend Street
Dorchester, MA 02121
(617) 635-9957
Dorchester, MA 02121
(617) 635-9957
Grades: 7-12
| 1,693 students
Rank: #44.
Fenway High School
Alternative School
(Math: 40-44% | Reading: 45-49%)
Rank:
Rank:
6/
Top 50%10
67 Alleghany St
Roxbury Crossing, MA 02120
(617) 635-9911
Roxbury Crossing, MA 02120
(617) 635-9911
Grades: 9-12
| 376 students
Rank: #55.
Boston Arts Academy
Alternative School
(Math: 20-24% | Reading: 60-64%)
Rank:
Rank:
6/
Top 50%10
174 Ipswich Street
Boston, MA 02215
(617) 635-6470
Boston, MA 02215
(617) 635-6470
Grades: 9-12
| 473 students
Rank: #6 - 86. - 8.
Carter School
(Math: <50% | Reading: <50% )
Rank:
Rank:
5/
Bottom 50%10
270 Columbia Rd
Dorchester, MA 02121
(617) 635-9832
Dorchester, MA 02121
(617) 635-9832
Grades: 7-12
| 31 students
Rank: #6 - 86. - 8.
Community Academy
(Math: <50% | Reading: <50% )
Rank:
Rank:
5/
Bottom 50%10
25 Glen Road
Jamaica Plain, MA 02130
(617) 635-8950
Jamaica Plain, MA 02130
(617) 635-8950
Grades: 9-12
| 41 students
Rank: #6 - 86. - 8.
Greater Egleston High School
(Math: <50% | Reading: <50% )
Rank:
Rank:
5/
Bottom 50%10
3134 Washington Street
Roxbury, MA 02119
(617) 635-6429
Roxbury, MA 02119
(617) 635-6429
Grades: 9-12
| 76 students
Rank: #99.
New Mission High School
Alternative School
(Math: 30% | Reading: 47%)
Rank:
Rank:
5/
Bottom 50%10
655 Metropolitan Ave
Hyde Park, MA 02136
(617) 635-6437
Hyde Park, MA 02136
(617) 635-6437
Grades: 7-12
| 668 students
Rank: #1010.
Quincy Upper School
(Math: 36% | Reading: 27%)
Rank:
Rank:
3/
Bottom 50%10
152 Arlington Street
Boston, MA 02116
(617) 635-8940
Boston, MA 02116
(617) 635-8940
Grades: 6-12
| 532 students
Rank: #1111.
Boston Collaborative High School
Alternative School
(Math: <50% | Reading: ≤20% )
Rank:
Rank:
3/
Bottom 50%10
215 Dorchester St
South Boston, MA 02127
(617) 635-8035
South Boston, MA 02127
(617) 635-8035
Grades: 9-12
| 218 students
Rank: #1212.
East Boston High School
(Math: 26% | Reading: 31%)
Rank:
Rank:
3/
Bottom 50%10
86 White Street
East Boston, MA 02128
(617) 635-9896
East Boston, MA 02128
(617) 635-9896
Grades: 7-12
| 1,293 students
Rank: #1313.
Another Course To College
Alternative School
(Math: 20-29% | Reading: 20-29%)
Rank:
Rank:
2/
Bottom 50%10
612 Metropolitan Av
Hyde Park, MA 02136
(617) 635-8865
Hyde Park, MA 02136
(617) 635-8865
Grades: 9-12
| 240 students
Rank: #1414.
Henderson K-12 Inclusion School Upper
(Math: 23% | Reading: 25%)
Rank:
Rank:
2/
Bottom 50%10
18 Croftland Av
Dorchester Center, MA 02124
(617) 635-6365
Dorchester Center, MA 02124
(617) 635-6365
Grades: 2-12
| 639 students
Rank: #1515.
Burke High School
(Math: 20-24% | Reading: 20-24%)
Rank:
Rank:
2/
Bottom 50%10
60 Washington Street
Dorchester, MA 02121
(617) 635-9837
Dorchester, MA 02121
(617) 635-9837
Grades: 7-12
| 395 students
Rank: #1616.
Excel High School
(Math: 15-19% | Reading: 20-24%)
Rank:
Rank:
2/
Bottom 50%10
95 G. Street, South Boston Edu
South Boston, MA 02127
(617) 635-9870
South Boston, MA 02127
(617) 635-9870
Grades: 9-12
| 387 students
Rank: #1717.
Community Academy Of Science And Health
(Math: 20-29% | Reading: 11-19%)
Rank:
Rank:
2/
Bottom 50%10
11 Charles Street
Dorchester, MA 02122
(617) 635-8950
Dorchester, MA 02122
(617) 635-8950
Grades: 9-12
| 341 students
Rank: #1818.
Horace Mann School For The Deaf Hard Of Hearing
Special Education School
(Math: ≤20% | Reading: ≤20%)
Rank:
Rank:
2/
Bottom 50%10
40 Armington Street
Allston, MA 02134
(617) 635-8534
Allston, MA 02134
(617) 635-8534
Grades: PK-12
| 73 students
Rank: #1919.
Lyon High School
(Math: ≤10% | Reading: 20-29%)
Rank:
Rank:
1/
Bottom 50%10
95 Beechcroft Street
Brighton, MA 02135
(617) 635-8351
Brighton, MA 02135
(617) 635-8351
Grades: 9-12
| 102 students
Rank: #2020.
Margarita Muniz Academy
(Math: 6-9% | Reading: 20-24%)
Rank:
Rank:
1/
Bottom 50%10
20 Child Street
Jamaica Plain, MA 02130
(617) 470-6907
Jamaica Plain, MA 02130
(617) 470-6907
Grades: 9-12
| 308 students
Rank: #21 - 2221. - 22.
Charlestown High School
(Math: 10-14% | Reading: 15-19%)
Rank:
Rank:
1/
Bottom 50%10
240 Medford Street
Charlestown, MA 02129
(617) 635-9914
Charlestown, MA 02129
(617) 635-9914
Grades: 7-12
| 789 students
Rank: #21 - 2221. - 22.
English High School
(Math: 10-14% | Reading: 15-19%)
Rank:
Rank:
1/
Bottom 50%10
144 Mcbride Street
Jamaica Plain, MA 02130
(617) 635-8979
Jamaica Plain, MA 02130
(617) 635-8979
Grades: 7-12
| 682 students
Rank: #23 - 2423. - 24.
Boston Community Leadership Academy
(Math: 8% | Reading: 18%)
Rank:
Rank:
1/
Bottom 50%10
655 Metropolitan Ave
Hyde Park, MA 02136
(617) 635-8937
Hyde Park, MA 02136
(617) 635-8937
Grades: 7-12
| 569 students
Rank: #23 - 2423. - 24.
Techboston Academy
(Math: 8% | Reading: 18%)
Rank:
Rank:
1/
Bottom 50%10
9 Peacevale Road
Dorchester Center, MA 02124
(617) 635-1615
Dorchester Center, MA 02124
(617) 635-1615
Grades: 6-12
| 870 students
Rank: #2525.
Snowden International High School
(Math: 6-9% | Reading: 15-19%)
Rank:
Rank:
1/
Bottom 50%10
150 Newbury Street
Boston, MA 02116
(617) 635-9989
Boston, MA 02116
(617) 635-9989
Grades: 9-12
| 445 students
Rank: #2626.
Brighton High School
(Math: ≤10% | Reading: 11-19%)
Rank:
Rank:
1/
Bottom 50%10
25 Warren Street
Brighton, MA 02135
(617) 635-9873
Brighton, MA 02135
(617) 635-9873
Grades: 7-12
| 584 students
Rank: #2727.
Dearborn 6-12 Stem Academy
(Math: 4% | Reading: 17%)
Rank:
Rank:
1/
Bottom 50%10
36 Winthrop St
Roxbury, MA 02119
(617) 635-8412
Roxbury, MA 02119
(617) 635-8412
Grades: 6-12
| 553 students
Rank: #2828.
Boston International High School & Newcomers Academy
(Math: ≤10% | Reading: ≤10%)
Rank:
Rank:
1/
Bottom 50%10
100 Maxwell St
Dorchester Center, MA 02124
(617) 635-9373
Dorchester Center, MA 02124
(617) 635-9373
Grades: 9-12
| 486 students
Rank: #2929.
Madison Park Technical Vocational High School
Vocational School
(Math: 7% | Reading: 11%)
Rank:
Rank:
1/
Bottom 50%10
75 Malcolm X Blvd
Roxbury Crossing, MA 02120
(617) 635-8970
Roxbury Crossing, MA 02120
(617) 635-8970
Grades: 9-12
| 1,058 students
Rank: #3030.
Melvin H. King South End Academy
(Math: ≤5% | Reading: ≤5%)
Rank:
Rank:
1/
Bottom 50%10
90 Warren Avenue
Boston, MA 02116
(617) 635-9976
Boston, MA 02116
(617) 635-9976
Grades: 2-12
| 134 students
Rank: n/an/a
Boston Adult Tech Academy
Alternative School
20 Church St
Boston, MA 02116
(617) 635-1542
Boston, MA 02116
(617) 635-1542
Grades: 11-12
| 185 students
Recent Articles

What Is A Charter School?
Explore the world of charter schools in this comprehensive guide. Learn about their history, how they operate, and the pros and cons of this educational innovation. Discover key facts about charter schools, including admission policies, demographics, and funding, as well as what to look for when considering a charter school for your child.

10 Reasons Why High School Sports Benefit Students
Discover the 10 compelling reasons why high school sports are beneficial for students. This comprehensive article explores how athletics enhance academic performance, foster personal growth, and develop crucial life skills. From improved fitness and time management to leadership development and community representation, learn why participating in high school sports can be a game-changer for students' overall success and well-being.

February 05, 2025
Understanding the U.S. Department of Education: Structure, Impact, and EvolutionWe explore how the Department of Education shapes American education, from its cabinet-level leadership to its impact on millions of students, written for general audiences seeking clarity on this vital institution.


