Top Rankings
New York City Geographic District #14 School District ranks among the top 20% of public school district in New York for:
Category
Attribute
Diversity
Most diverse schools (Top 1%)
Community Size
Largest student body (number of students) (Top 1%)
For the 2025 school year, there are 28 public elementary schools serving 10,072 students in New York City Geographic District #14 School District. This district's average elementary testing ranking is 5/10, which is in the bottom 50% of public elementary schools in New York.
Public Elementary Schools in New York City Geographic District #14 School District have an average math proficiency score of 33% (versus the New York public elementary school average of 41%), and reading proficiency score of 48% (versus the 48% statewide average).
Minority enrollment is 79% of the student body (majority Hispanic), which is more than the New York public elementary school average of 61% (majority Hispanic).
Overview
This School District
This State (NY)
# Schools
38 Schools
3,702 Schools
# Students
15,154 Students
1,750,092 Students
# Teachers
1,279 Teachers
153,310 Teachers
Student : Teacher Ratio
12:1
12:1
District Rank
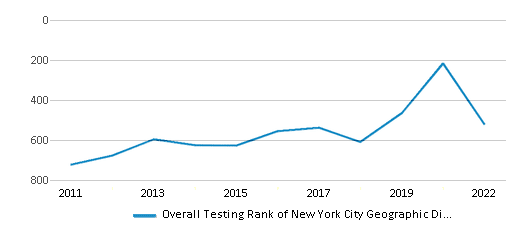
New York City Geographic District #14 School District, which is ranked #509 of all 1,015 school districts in New York (based off of combined math and reading proficiency testing data) for the 2021-2022 school year.
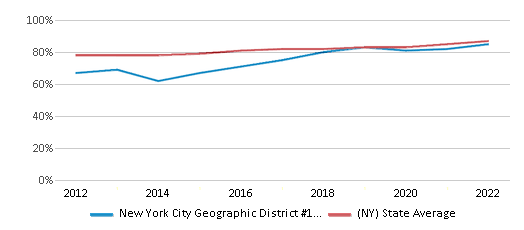
The school district's graduation rate of 85% has increased from 75% over five school years.
Overall District Rank
#521 out of 1020 school districts
(Bottom 50%)
(Bottom 50%)
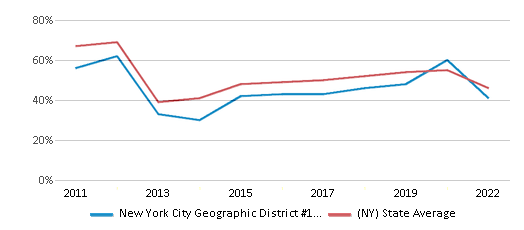
Math Test Scores (% Proficient)
41%
46%
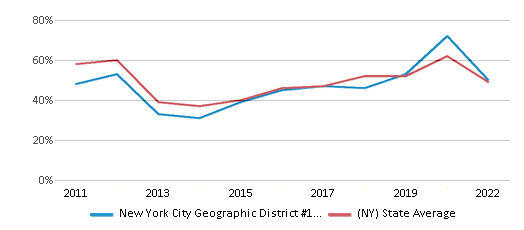
Reading/Language Arts Test Scores (% Proficient)
50%
49%
Science Test Scores (% Proficient)
77%
78%
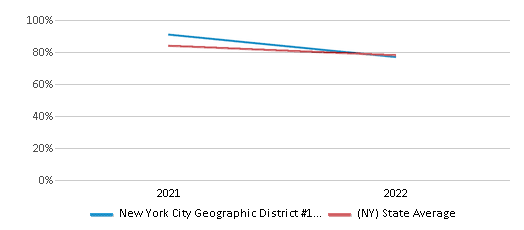
Graduation Rate
85%
87%
Students by Ethnicity:
Diversity Score
0.64
0.73
# American Indian Students
91 Students
14,013 Students
% American Indian Students
n/a
1%
# Asian Students
804 Students
175,821 Students
% Asian Students
5%
10%
# Hispanic Students
8,287 Students
531,348 Students
% Hispanic Students
55%
30%
# Black Students
3,003 Students
278,768 Students
% Black Students
20%
16%
# White Students
2,369 Students
682,836 Students
% White Students
16%
39%
# Hawaiian Students
44 Students
3,810 Students
% Hawaiian Students
n/a
n/a
# Two or more races Students
551 Students
63,556 Students
% of Two or more races Students
4%
4%
Students by Grade:
# Students in PK Grade:
920
60,112
# Students in K Grade:
951
169,096
# Students in 1st Grade:
911
177,074
# Students in 2nd Grade:
909
181,096
# Students in 3rd Grade:
912
177,104
# Students in 4th Grade:
895
180,516
# Students in 5th Grade:
881
181,163
# Students in 6th Grade:
927
184,038
# Students in 7th Grade:
967
161,270
# Students in 8th Grade:
951
161,773
# Students in 9th Grade:
1,528
24,993
# Students in 10th Grade:
1,566
23,859
# Students in 11th Grade:
1,421
21,596
# Students in 12th Grade:
1,336
21,027
# Ungraded Students:
79
25,375
Best New York City Geographic District #14 School District Public Elementary Schools (2025)
School
(Math and Reading Proficiency)
(Math and Reading Proficiency)
Location
Grades
Students
Rank: #11.
P.s. 31 Samuel F Dupont
Magnet School
(Math: 85-89% | Reading: 85-89%)
Rank:
Rank:
10/
Top 10%10
75 Meserole Ave
Brooklyn, NY 11222
(718) 383-8998
Brooklyn, NY 11222
(718) 383-8998
Grades: PK-5
| 583 students
Rank: #22.
P.s. 34 Oliver H Perry
(Math: 65-69% | Reading: 65-69%)
Rank:
Rank:
9/
Top 20%10
131 Norman Ave
Brooklyn, NY 11222
(718) 389-5842
Brooklyn, NY 11222
(718) 389-5842
Grades: PK-5
| 413 students
Rank: #33.
P.s. 132 Conselyea School
(Math: 55-59% | Reading: 60-64%)
Rank:
Rank:
8/
Top 30%10
320 Manhattan Ave
Brooklyn, NY 11211
(718) 599-7301
Brooklyn, NY 11211
(718) 599-7301
Grades: PK-5
| 592 students
Rank: #44.
I.s. 318 Eugenio Maria De Hostos
Magnet School
(Math: 45% | Reading: 72%)
Rank:
Rank:
7/
Top 50%10
101 Walton St
Brooklyn, NY 11206
(718) 782-0589
Brooklyn, NY 11206
(718) 782-0589
Grades: 6-8
| 999 students
Rank: #55.
Young Women's Leadership School Of Brooklyn
(Math: 40-44% | Reading: 65-69%)
Rank:
Rank:
7/
Top 50%10
325 Bushwick Ave
Brooklyn, NY 11206
(718) 387-5641
Brooklyn, NY 11206
(718) 387-5641
Grades: 6-12
| 261 students
Rank: #66.
P.s. 110 Monitor
(Math: 45-49% | Reading: 55-59%)
Rank:
Rank:
7/
Top 50%10
124 Monitor St
Brooklyn, NY 11222
(718) 383-7600
Brooklyn, NY 11222
(718) 383-7600
Grades: PK-5
| 477 students
Rank: #77.
Brooklyn Arbor Elementary School
Magnet School
(Math: 39% | Reading: 52%)
Rank:
Rank:
6/
Top 50%10
325 S 3rd St
Brooklyn, NY 11238
(718) 963-0393
Brooklyn, NY 11238
(718) 963-0393
Grades: PK-5
| 534 students
Rank: #88.
Conselyea Preparatory School
(Math: 28% | Reading: 63%)
Rank:
Rank:
5/
Bottom 50%10
208 N 5th St
Brooklyn, NY 11211
(718) 486-6211
Brooklyn, NY 11211
(718) 486-6211
Grades: 6-8
| 424 students
Rank: #99.
P.s. 380 John Wayne Elementary School
(Math: 35-39% | Reading: 40-44%)
Rank:
Rank:
5/
Bottom 50%10
370 Marcy Ave
Brooklyn, NY 11206
(718) 388-0607
Brooklyn, NY 11206
(718) 388-0607
Grades: PK-5
| 375 students
Rank: #1010.
Junior High School 50 John D Wells
Magnet School
(Math: 31% | Reading: 47%)
Rank:
Rank:
4/
Bottom 50%10
183 S 3rd St
Brooklyn, NY 11211
(718) 387-4184
Brooklyn, NY 11211
(718) 387-4184
Grades: 6-8
| 379 students
Rank: #1111.
P.s. 147 Issac Remsen
(Math: 25-29% | Reading: 40-44%)
Rank:
Rank:
4/
Bottom 50%10
325 Bushwick Ave
Brooklyn, NY 11206
(718) 497-0326
Brooklyn, NY 11206
(718) 497-0326
Grades: PK-5
| 185 students
Rank: #12 - 1412. - 14.
P.s. 17 Henry D Woodworth
(Math: 35-39% | Reading: 30-34%)
Rank:
Rank:
4/
Bottom 50%10
208 N 5th St
Brooklyn, NY 11211
(718) 387-2929
Brooklyn, NY 11211
(718) 387-2929
Grades: PK-5
| 202 students
Rank: #12 - 1412. - 14.
P.s. 196 Ten Eyck
Magnet School
(Math: 35-39% | Reading: 30-34%)
Rank:
Rank:
4/
Bottom 50%10
207 Bushwick Ave
Brooklyn, NY 11206
(718) 497-0139
Brooklyn, NY 11206
(718) 497-0139
Grades: PK-5
| 285 students
Rank: #12 - 1412. - 14.
P.s. 297 Abraham Stockton
(Math: 35-39% | Reading: 30-34%)
Rank:
Rank:
4/
Bottom 50%10
700 Park Ave
Brooklyn, NY 11206
(718) 388-4581
Brooklyn, NY 11206
(718) 388-4581
Grades: PK-5
| 207 students
Rank: #1515.
P.s. 250 George H Lindsay
Magnet School
(Math: 40-44% | Reading: 25-29%)
Rank:
Rank:
3/
Bottom 50%10
108 Montrose Ave
Brooklyn, NY 11206
(718) 384-0889
Brooklyn, NY 11206
(718) 384-0889
Grades: PK-5
| 256 students
Rank: #1616.
P.s. 257 John F Hylan
Magnet School
(Math: 25-29% | Reading: 35-39%)
Rank:
Rank:
3/
Bottom 50%10
60 Cook St
Brooklyn, NY 11206
(718) 384-7128
Brooklyn, NY 11206
(718) 384-7128
Grades: PK-5
| 474 students
Rank: #1717.
Middle School 582
Magnet School
(Math: 16% | Reading: 43%)
Rank:
Rank:
3/
Bottom 50%10
207 Bushwick Ave
Brooklyn, NY 11206
(718) 456-8218
Brooklyn, NY 11206
(718) 456-8218
Grades: 6-8
| 316 students
Rank: #1818.
P.s. 84 Jose De Diego
Magnet School
(Math: 21% | Reading: 40%)
Rank:
Rank:
3/
Bottom 50%10
250 Berry St
Brooklyn, NY 11211
(718) 384-8063
Brooklyn, NY 11211
(718) 384-8063
Grades: PK-8
| 629 students
Rank: #1919.
Lyons Community School
(Math: ≤10% | Reading: 40-44%)
Rank:
Rank:
2/
Bottom 50%10
223 Graham Ave
Brooklyn, NY 11206
(718) 782-0918
Brooklyn, NY 11206
(718) 782-0918
Grades: 6-12
| 384 students
Rank: #2020.
P.s. 59 The Dawn Best School
(Math: 25-29% | Reading: 25-29%)
Rank:
Rank:
2/
Bottom 50%10
211 Throop Ave
Brooklyn, NY 11206
(718) 443-3600
Brooklyn, NY 11206
(718) 443-3600
Grades: PK-5
| 301 students
Rank: #2121.
Juan Morel Campos Secondary School
(Math: 20-24% | Reading: 25-29%)
Rank:
Rank:
2/
Bottom 50%10
215 Heyward St
Brooklyn, NY 11206
(718) 302-7900
Brooklyn, NY 11206
(718) 302-7900
Grades: 6-12
| 474 students
Rank: #2222.
John Ericsson Middle School 126
Magnet School
(Math: 10-14% | Reading: 34%)
Rank:
Rank:
2/
Bottom 50%10
424 Leonard St
Brooklyn, NY 11222
(718) 782-2527
Brooklyn, NY 11222
(718) 782-2527
Grades: 6-8
| 158 students
Rank: #2323.
P.s. 120 Carlos Tapia
Magnet School
(Math: 15-19% | Reading: 20-24%)
Rank:
Rank:
1/
Bottom 50%10
18 Beaver St
Brooklyn, NY 11206
(718) 455-1000
Brooklyn, NY 11206
(718) 455-1000
Grades: PK-5
| 291 students
Rank: #2424.
P.s. 23 Carter G Woodson
(Math: 15-19% | Reading: 15-19%)
Rank:
Rank:
1/
Bottom 50%10
545 Willoughby Ave
Brooklyn, NY 11206
(718) 387-0375
Brooklyn, NY 11206
(718) 387-0375
Grades: PK-5
| 221 students
Rank: #2525.
Ps/is 157 Benjamin Franklin Heath And Science Academy
Magnet School
(Math: 10-14% | Reading: 20-24%)
Rank:
Rank:
1/
Bottom 50%10
850 Kent Ave
Brooklyn, NY 11205
(718) 622-9285
Brooklyn, NY 11205
(718) 622-9285
Grades: PK-8
| 244 students
Rank: #2626.
P.s. 16 Leonard Dunkly
(Math: 10-14% | Reading: 15-19%)
Rank:
Rank:
1/
Bottom 50%10
157 Wilson St
Brooklyn, NY 11211
(718) 782-5352
Brooklyn, NY 11211
(718) 782-5352
Grades: PK-5
| 160 students
Rank: #2727.
P.s. 18 Edward Bush
Magnet School
(Math: 6-9% | Reading: 15-19%)
Rank:
Rank:
1/
Bottom 50%10
101 Maujer St
Brooklyn, NY 11206
(718) 387-3241
Brooklyn, NY 11206
(718) 387-3241
Grades: PK-5
| 165 students
Recent Articles

Sexual Harassment at Age 6: The Tale of a First Grade Suspension
A six-year old in Aurora, Colorado, was suspended after singing an LMFAO song to a little girl in his class and reportedly “shaking his booty.” We look at the case and the sexual harassment problem in public schools today.

How Scaffolding Could Change the Way Your Child Learns
This article explores the concept of instructional scaffolding, a teaching method that enhances learning by breaking down complex tasks into manageable parts. It highlights how scaffolding supports students in developing critical thinking skills and becoming more independent learners. The article discusses the benefits of scaffolding, including improved engagement and reduced anxiety, and provides strategies for its implementation across various educational levels.

February 05, 2025
Understanding the U.S. Department of Education: Structure, Impact, and EvolutionWe explore how the Department of Education shapes American education, from its cabinet-level leadership to its impact on millions of students, written for general audiences seeking clarity on this vital institution.


