Top Rankings
Bellingham School District ranks among the top 20% of public school district in Washington for:
Category
Attribute
Science Proficiency
Highest science proficiency (Top 20%)
Community Size
Largest student body (number of students) (Top 1%)
For the 2025 school year, there are 25 public schools serving 11,487 students in Bellingham School District. This district's average testing ranking is 8/10, which is in the top 30% of public schools in Washington.
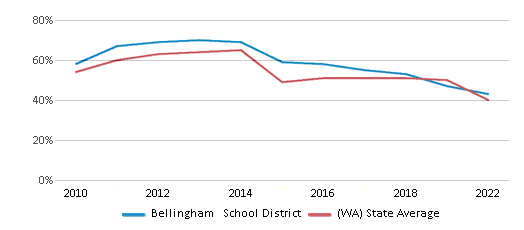
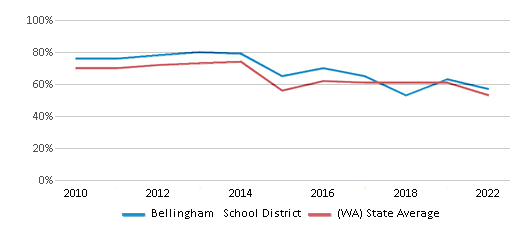
Public Schools in Bellingham School District have an average math proficiency score of 43% (versus the Washington public school average of 40%), and reading proficiency score of 57% (versus the 53% statewide average).
Minority enrollment is 36% of the student body (majority Hispanic), which is less than the Washington public school average of 52% (majority Hispanic).
Overview
This School District
This State (WA)
# Schools
25 Schools
2,565 Schools
# Students
11,487 Students
1,102,128 Students
# Teachers
665 Teachers
62,276 Teachers
Student : Teacher Ratio
17:1
17:1
District Rank
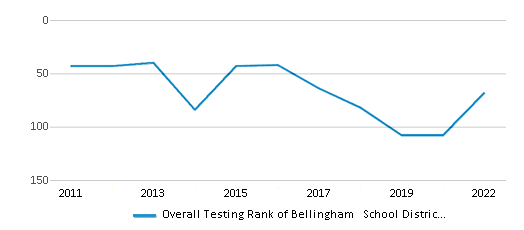
Bellingham School District, which is ranked within the top 30% of all 306 school districts in Washington (based off of combined math and reading proficiency testing data) for the 2021-2022 school year.
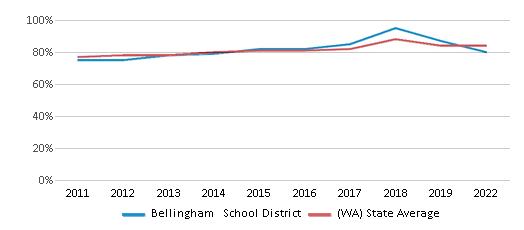
The school district's graduation rate of 80% has decreased from 82% over five school years.
Overall District Rank
#68 out of 307 school districts
(Top 30%)
(Top 30%)
Math Test Scores (% Proficient)
43%
40%
Reading/Language Arts Test Scores (% Proficient)
57%
53%
Science Test Scores (% Proficient)
57%
49%
Graduation Rate
80%
84%
Students by Ethnicity:
Diversity Score
0.55
0.69
# American Indian Students
101 Students
14,077 Students
% American Indian Students
1%
1%
# Asian Students
542 Students
97,776 Students
% Asian Students
5%
9%
# Hispanic Students
2,226 Students
284,936 Students
% Hispanic Students
19%
26%
# Black Students
181 Students
52,278 Students
% Black Students
2%
5%
# White Students
7,316 Students
529,029 Students
% White Students
64%
48%
# Hawaiian Students
34 Students
15,943 Students
% Hawaiian Students
n/a
2%
# Two or more races Students
989 Students
97,437 Students
% of Two or more races Students
9%
9%
Students by Grade:
# Students in PK Grade:
109
24,937
# Students in K Grade:
946
76,570
# Students in 1st Grade:
769
77,991
# Students in 2nd Grade:
826
81,918
# Students in 3rd Grade:
810
78,358
# Students in 4th Grade:
782
81,181
# Students in 5th Grade:
841
81,842
# Students in 6th Grade:
829
80,681
# Students in 7th Grade:
811
81,501
# Students in 8th Grade:
845
82,250
# Students in 9th Grade:
920
86,778
# Students in 10th Grade:
982
88,755
# Students in 11th Grade:
882
87,581
# Students in 12th Grade:
1,135
91,785
# Ungraded Students:
-
-
District Revenue and Spending
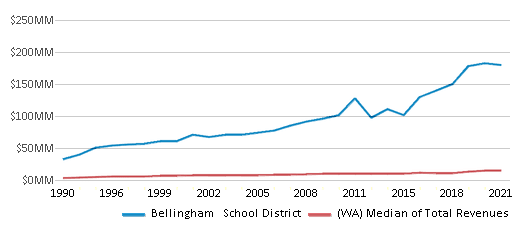
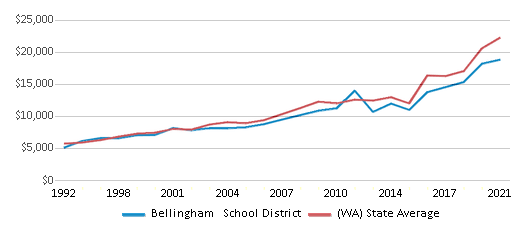
The revenue/student of $18,822 is higher than the state median of $18,796. The school district revenue/student has stayed relatively flat over four school years.
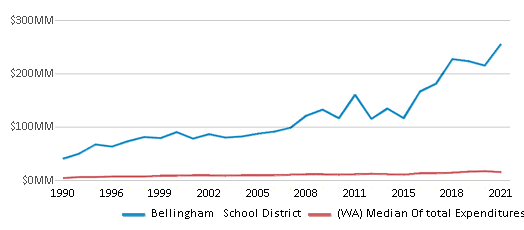
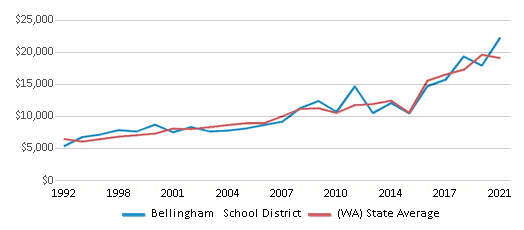
The school district's spending/student of $22,233 is higher than the state median of $19,246. The school district spending/student has stayed relatively flat over four school years.
Total Revenue
$216 MM
$20,715 MM
Spending
$255 MM
$21,212 MM
Revenue / Student
$18,822
$18,796
Spending / Student
$22,233
$19,246
Best Bellingham School District Public Schools (2025)
School
(Math and Reading Proficiency)
(Math and Reading Proficiency)
Location
Grades
Students
Rank: #11.
Sehome High School
(Math: 57% | Reading: 89%)
Rank:
Rank:
10/
Top 10%10
2700 Bill Mcdonald Pkwy
Bellingham, WA 98225
(360) 676-6481
Bellingham, WA 98225
(360) 676-6481
Grades: 9-12
| 1,175 students
Rank: #22.
Silver Beach Elementary School
(Math: 68% | Reading: 73%)
Rank:
Rank:
10/
Top 10%10
4101 Academy St
Bellingham, WA 98226
(360) 676-6443
Bellingham, WA 98226
(360) 676-6443
Grades: PK-5
| 342 students
Rank: #33.
Bellingham High School
(Math: 50% | Reading: 79%)
Rank:
Rank:
9/
Top 20%10
2020 Cornwall Ave
Bellingham, WA 98225
(360) 676-6575
Bellingham, WA 98225
(360) 676-6575
Grades: 9-12
| 1,188 students
Rank: #44.
Lowell Elementary School
(Math: 50-54% | Reading: 60-64%)
Rank:
Rank:
8/
Top 30%10
914 15th St
Bellingham, WA 98225
(360) 676-6430
Bellingham, WA 98225
(360) 676-6430
Grades: PK-5
| 308 students
Rank: #55.
Parkview Elementary School
(Math: 55-59% | Reading: 55-59%)
Rank:
Rank:
8/
Top 30%10
3030 Cornwall Ave
Bellingham, WA 98225
(360) 676-6433
Bellingham, WA 98225
(360) 676-6433
Grades: PK-5
| 387 students
Rank: #66.
Columbia Elementary School
(Math: 50-54% | Reading: 55-59%)
Rank:
Rank:
8/
Top 30%10
2508 Utter St
Bellingham, WA 98225
(360) 676-6413
Bellingham, WA 98225
(360) 676-6413
Grades: PK-5
| 210 students
Rank: #77.
Kulshan Middle School
(Math: 47% | Reading: 62%)
Rank:
Rank:
8/
Top 30%10
1250 Kenoyer Dr
Bellingham, WA 98229
(360) 676-4886
Bellingham, WA 98229
(360) 676-4886
Grades: 6-8
| 599 students
Rank: #88.
Squalicum High School
(Math: 34% | Reading: 78%)
Rank:
Rank:
8/
Top 30%10
3773 E Mcleod Rd
Bellingham, WA 98226
(360) 676-6471
Bellingham, WA 98226
(360) 676-6471
Grades: 9-12
| 1,241 students
Rank: #99.
Fairhaven Middle School
(Math: 46% | Reading: 60%)
Rank:
Rank:
7/
Top 50%10
110 Park Ridge Rd
Bellingham, WA 98225
(360) 676-6450
Bellingham, WA 98225
(360) 676-6450
Grades: 6-8
| 581 students
Rank: #1010.
Wade King Elementary School
(Math: 40-44% | Reading: 55-59%)
Rank:
Rank:
7/
Top 50%10
2155 Yew Street Rd
Bellingham, WA 98229
(360) 676-6840
Bellingham, WA 98229
(360) 676-6840
Grades: PK-5
| 315 students
Rank: #1111.
Bellingham Family Partnership Program
Alternative School
(Math: ≥50% | Reading: ≥50%)
Rank:
Rank:
7/
Top 50%10
1409 18th St
Bellingham, WA 98225
(360) 676-6424
Bellingham, WA 98225
(360) 676-6424
Grades: K-12
| 254 students
Rank: #1212.
Northern Heights Elementary School
(Math: 45-49% | Reading: 50-54%)
Rank:
Rank:
7/
Top 50%10
4000 Magrath Rd
Bellingham, WA 98226
(360) 647-6820
Bellingham, WA 98226
(360) 647-6820
Grades: PK-5
| 420 students
Rank: #1313.
Whatcom Middle School
(Math: 43% | Reading: 54%)
Rank:
Rank:
6/
Top 50%10
810 Halleck St
Bellingham, WA 98225
(360) 676-6460
Bellingham, WA 98225
(360) 676-6460
Grades: 6-8
| 639 students
Rank: #1414.
Sunnyland Elementary School
(Math: 40-44% | Reading: 50-54%)
Rank:
Rank:
6/
Top 50%10
2800 James St
Bellingham, WA 98225
(360) 676-6446
Bellingham, WA 98225
(360) 676-6446
Grades: PK-5
| 328 students
Rank: #1515.
Happy Valley Elementary School
(Math: 46% | Reading: 51%)
Rank:
Rank:
6/
Top 50%10
1041 24th St
Bellingham, WA 98225
(360) 676-6420
Bellingham, WA 98225
(360) 676-6420
Grades: PK-5
| 468 students
Rank: #1616.
Carl Cozier Elementary School
(Math: 45-49% | Reading: 45-49%)
Rank:
Rank:
6/
Top 50%10
1330 Lincoln St
Bellingham, WA 98229
(360) 676-6410
Bellingham, WA 98229
(360) 676-6410
Grades: PK-5
| 342 students
Rank: #1717.
Geneva Elementary School
(Math: 38% | Reading: 52%)
Rank:
Rank:
6/
Top 50%10
1401 Geneva St
Bellingham, WA 98229
(360) 676-6416
Bellingham, WA 98229
(360) 676-6416
Grades: PK-5
| 424 students
Rank: #1818.
Roosevelt Elementary School
(Math: 35-39% | Reading: 45-49%)
Rank:
Rank:
5/
Bottom 50%10
2900 Yew St
Bellingham, WA 98226
(360) 676-6440
Bellingham, WA 98226
(360) 676-6440
Grades: PK-5
| 373 students
Rank: #1919.
Visions (Seamar Youth Center)
Alternative School
(Math: <50% | Reading: ≥50% )
Rank:
Rank:
5/
Bottom 50%10
1603 E Illinois St
Bellingham, WA 98225
(360) 647-6871
Bellingham, WA 98225
(360) 647-6871
Grades: 6-12
| 10 students
Rank: #2020.
Options High School
Alternative School
(Math: 21-39% | Reading: 40-59%)
Rank:
Rank:
4/
Bottom 50%10
2015 Franklin St
Bellingham, WA 98225
(360) 647-6871
Bellingham, WA 98225
(360) 647-6871
Grades: 9-12
| 206 students
Rank: #2121.
Shuksan Middle School
(Math: 25% | Reading: 41%)
Rank:
Rank:
3/
Bottom 50%10
2717 Alderwood Ave
Bellingham, WA 98225
(360) 676-6454
Bellingham, WA 98225
(360) 676-6454
Grades: 6-8
| 578 students
Rank: #22 - 2322. - 23.
Alderwood Elementary School
(Math: 25-29% | Reading: 30-34%)
Rank:
Rank:
2/
Bottom 50%10
3400 Hollywood Ave
Bellingham, WA 98225
(360) 676-6404
Bellingham, WA 98225
(360) 676-6404
Grades: PK-5
| 282 students
Rank: #22 - 2322. - 23.
Birchwood Elementary School
(Math: 25-29% | Reading: 30-34%)
Rank:
Rank:
2/
Bottom 50%10
3200 Pinewood Ave
Bellingham, WA 98225
(360) 676-6466
Bellingham, WA 98225
(360) 676-6466
Grades: PK-5
| 362 students
Rank: #2424.
Cordata Elementary School
(Math: 10-14% | Reading: 10-14%)
Rank:
Rank:
1/
Bottom 50%10
4420 Aldrich Rd
Bellingham, WA 98226
(360) 676-6461
Bellingham, WA 98226
(360) 676-6461
Grades: PK-5
| 353 students
Rank: n/an/a
Bellingham Re-engagement Program
Alternative School
1306 Dupont St
Bellingham, WA 98225
(360) 676-6400
Bellingham, WA 98225
(360) 676-6400
Grades: 9-12
| 102 students
Frequently Asked Questions
How many schools belong to Bellingham School District?
Bellingham School District manages 25 public schools serving 11,487 students.
What is the rank of Bellingham School District?
Bellingham School District is ranked #69 out of 306 school districts in Washington (top 30%) based off of combined math and reading proficiency testing data for the 2021-2022 school year. This district ranks in the top 20% of Washington school districts for: Highest science proficiency (Top 20%) and Largest student body (number of students) (Top 1%)
What is the racial composition of students in Bellingham School District?
64% of Bellingham School District students are White, 19% of students are Hispanic, 9% of students are Two or more races, 5% of students are Asian, 2% of students are Black, and 1% of students are American Indian.
What is the student/teacher ratio of Bellingham School District?
Bellingham School District has a student/teacher ratio of 17:1, which is lower than the Washington state average of 18:1.
What is Bellingham School District's spending/student ratio?
The school district's spending/student of $22,233 is higher than the state median of $19,246. The school district spending/student has stayed relatively flat over four school years.
Recent Articles

Year-Round Or Traditional Schedule?
Which is more appropriate for your child? A year-round attendance schedule or traditional schedule? We look at the pros and cons.

Why You Should Encourage Your Child to Join a Sports Team
Participating in team sports has a great many benefits for children, there is no doubt. In this article you will learn what those benefits are.

White Students are Now the Minority in U.S. Public Schools
Increasing birth rates among immigrant families from Asia and Central and South America, combined with lower birth rates among white families, means that for the first time in history, public school students in the United States are majority-minority. This shift in demographics poses difficulties for schools as they work to accommodate children of varying language abilities and socio-economic backgrounds.


