Top Rankings
Seattle School District No. 1 ranks among the top 20% of public school district in Washington for:
Category
Attribute
Overall Rank
Highest overall rank (Top 10%)
Math Proficiency
Highest math proficiency (Top 10%)
Reading/Language Arts Proficiency
Highest reading/language arts proficiency (Top 20%)
Science Proficiency
Highest science proficiency (Top 20%)
Diversity
Most diverse schools (Top 1%)
Community Size
Largest student body (number of students) (Top 1%)
For the 2025 school year, there are 109 public schools serving 50,770 students in Seattle School District No. 1. This district's average testing ranking is 10/10, which is in the top 10% of public schools in Washington.
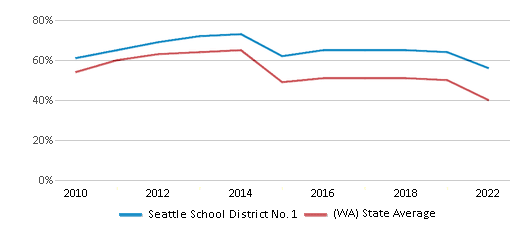
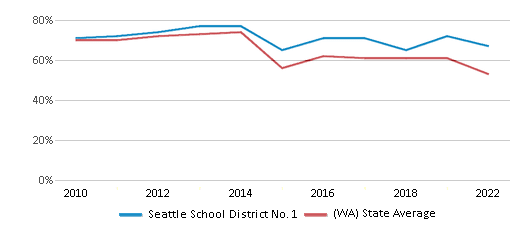
Public Schools in Seattle School District No. 1 have an average math proficiency score of 56% (versus the Washington public school average of 40%), and reading proficiency score of 67% (versus the 53% statewide average).
Minority enrollment is 56% of the student body (majority Hispanic and Black), which is more than the Washington public school average of 52% (majority Hispanic).
Overview
This School District
This State (WA)
# Schools
109 Schools
2,565 Schools
# Students
50,770 Students
1,102,128 Students
# Teachers
3,031 Teachers
62,276 Teachers
Student : Teacher Ratio
17:1
17:1
District Rank
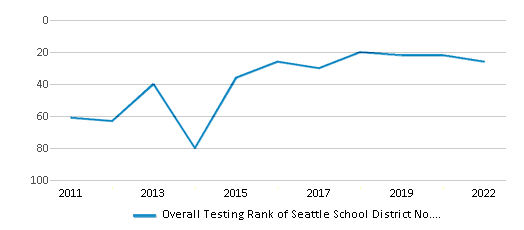
Seattle School District No. 1, which is ranked within the top 10% of all 306 school districts in Washington (based off of combined math and reading proficiency testing data) for the 2021-2022 school year.
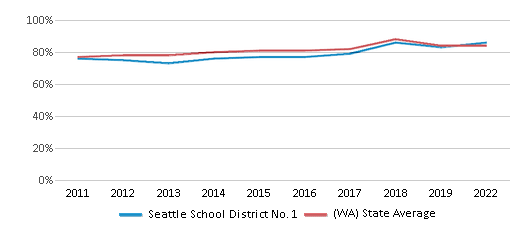
The school district's graduation rate of 86% has increased from 77% over five school years.
Overall District Rank
#26 out of 307 school districts
(Top 10%)
(Top 10%)
Math Test Scores (% Proficient)
56%
40%
Reading/Language Arts Test Scores (% Proficient)
67%
53%
Science Test Scores (% Proficient)
61%
49%
Graduation Rate
86%
84%
Students by Ethnicity:
Diversity Score
0.74
0.69
# American Indian Students
224 Students
14,077 Students
% American Indian Students
1%
1%
# Asian Students
6,314 Students
97,776 Students
% Asian Students
13%
9%
# Hispanic Students
7,311 Students
284,936 Students
% Hispanic Students
14%
26%
# Black Students
7,135 Students
52,278 Students
% Black Students
14%
5%
# White Students
22,531 Students
529,029 Students
% White Students
44%
48%
# Hawaiian Students
258 Students
15,943 Students
% Hawaiian Students
1%
2%
# Two or more races Students
6,347 Students
97,437 Students
% of Two or more races Students
13%
9%
Students by Grade:
# Students in PK Grade:
1,105
24,937
# Students in K Grade:
3,705
76,570
# Students in 1st Grade:
3,891
77,991
# Students in 2nd Grade:
3,987
81,918
# Students in 3rd Grade:
3,683
78,358
# Students in 4th Grade:
3,967
81,181
# Students in 5th Grade:
3,940
81,842
# Students in 6th Grade:
3,534
80,681
# Students in 7th Grade:
3,467
81,501
# Students in 8th Grade:
3,589
82,250
# Students in 9th Grade:
3,785
86,778
# Students in 10th Grade:
3,837
88,755
# Students in 11th Grade:
4,089
87,581
# Students in 12th Grade:
4,191
91,785
# Ungraded Students:
-
-
District Revenue and Spending
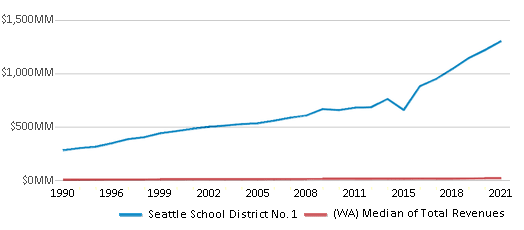
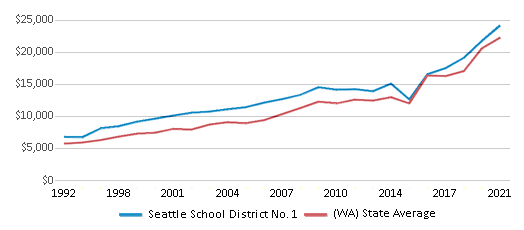
The revenue/student of $25,664 is higher than the state median of $18,796. The school district revenue/student has grown by 6% over four school years.
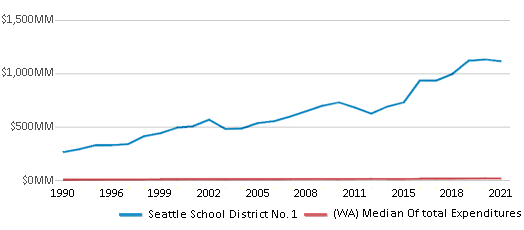
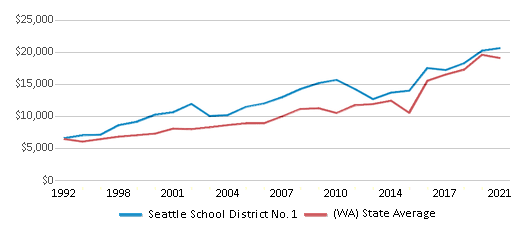
The school district's spending/student of $21,949 is higher than the state median of $19,246. The school district spending/student has grown by 6% over four school years.
Total Revenue
$1,303 MM
$20,715 MM
Spending
$1,114 MM
$21,212 MM
Revenue / Student
$25,664
$18,796
Spending / Student
$21,949
$19,246
Best Seattle School District No. 1 Public Schools (2025)
School
(Math and Reading Proficiency)
(Math and Reading Proficiency)
Location
Grades
Students
Rank: #11.
Cascadia Elementary School
Magnet School
(Math: 98% | Reading: 97%)
Rank:
Rank:
10/
Top 1%10
1700 N 90th Street
Seattle, WA 98115
(206) 252-5914
Seattle, WA 98115
(206) 252-5914
Grades: K-5
| 485 students
Rank: #22.
Stephen Decatur Elementary School
(Math: ≥95% | Reading: ≥95%)
Rank:
Rank:
10/
Top 1%10
7711 43rd Ave Ne
Seattle, WA 98115
(206) 252-3230
Seattle, WA 98115
(206) 252-3230
Grades: K-5
| 187 students
Rank: #33.
Frantz Coe Elementary School
(Math: 86% | Reading: 90%)
Rank:
Rank:
10/
Top 1%10
2424 7 Av W
Seattle, WA 98119
(206) 252-2000
Seattle, WA 98119
(206) 252-2000
Grades: K-5
| 447 students
Rank: #44.
John Stanford International School
(Math: 86% | Reading: 88%)
Rank:
Rank:
10/
Top 5%10
4057 5 Av Ne
Seattle, WA 98105
(206) 252-6080
Seattle, WA 98105
(206) 252-6080
Grades: K-5
| 417 students
Rank: #5 - 65. - 6.
View Ridge Elementary School
(Math: 80-84% | Reading: 85-89%)
Rank:
Rank:
10/
Top 5%10
7047 50 Av Ne
Seattle, WA 98115
(206) 252-5600
Seattle, WA 98115
(206) 252-5600
Grades: PK-5
| 282 students
Rank: #5 - 65. - 6.
Wedgwood Elementary School
(Math: 80-84% | Reading: 85-89%)
Rank:
Rank:
10/
Top 5%10
2720 Ne 85 St
Seattle, WA 98115
(206) 252-5670
Seattle, WA 98115
(206) 252-5670
Grades: K-5
| 355 students
Rank: #77.
Lincoln High School
(Math: 72% | Reading: 92%)
Rank:
Rank:
10/
Top 5%10
4400 Interlake Ave N
Seattle, WA 98103
(206) 413-2500
Seattle, WA 98103
(206) 413-2500
Grades: 9-12
| 1,697 students
Rank: #88.
Mcdonald International School
(Math: 86% | Reading: 81%)
Rank:
Rank:
10/
Top 5%10
144 Ne 54th St
Seattle, WA 98105
(206) 252-2900
Seattle, WA 98105
(206) 252-2900
Grades: K-5
| 474 students
Rank: #9 - 119. - 11.
Adams Elementary School
(Math: 75-79% | Reading: 80-84%)
Rank:
Rank:
10/
Top 5%10
6110 28 Av Nw
Seattle, WA 98107
(206) 252-1300
Seattle, WA 98107
(206) 252-1300
Grades: K-5
| 302 students
Rank: #9 - 119. - 11.
Lawton Elementary School
(Math: 75-79% | Reading: 80-84%)
Rank:
Rank:
10/
Top 5%10
4000 27 Av W
Seattle, WA 98199
(206) 252-2130
Seattle, WA 98199
(206) 252-2130
Grades: K-5
| 322 students
Rank: #9 - 119. - 11.
Montlake Elementary School
(Math: 75-79% | Reading: 80-84%)
Rank:
Rank:
10/
Top 5%10
2409 22 Av E
Seattle, WA 98112
(206) 252-3300
Seattle, WA 98112
(206) 252-3300
Grades: K-5
| 167 students
Rank: #1212.
Bryant Elementary School
(Math: 75% | Reading: 85%)
Rank:
Rank:
10/
Top 5%10
3311 Ne 60 St
Seattle, WA 98115
(206) 252-5200
Seattle, WA 98115
(206) 252-5200
Grades: K-5
| 477 students
Rank: #1313.
West Woodland Elementary School
(Math: 73% | Reading: 86%)
Rank:
Rank:
10/
Top 5%10
5601 4 Av Nw
Seattle, WA 98107
(206) 252-1600
Seattle, WA 98107
(206) 252-1600
Grades: K-5
| 380 students
Rank: #1414.
Ballard High School
(Math: 67% | Reading: 94%)
Rank:
Rank:
10/
Top 5%10
1418 Nw 65 St
Seattle, WA 98117
(206) 252-1000
Seattle, WA 98117
(206) 252-1000
Grades: 9-12
| 1,645 students
Rank: #1515.
Roosevelt High School
(Math: 68% | Reading: 88%)
Rank:
Rank:
10/
Top 5%10
1410 Ne 66 St
Seattle, WA 98115
(206) 252-4810
Seattle, WA 98115
(206) 252-4810
Grades: 9-12
| 1,528 students
Rank: #16 - 1716. - 17.
Catharine Blaine K-8 School
(Math: 72% | Reading: 82%)
Rank:
Rank:
10/
Top 5%10
2550 34 Av W
Seattle, WA 98199
(206) 252-1920
Seattle, WA 98199
(206) 252-1920
Grades: K-8
| 436 students
Rank: #16 - 1716. - 17.
Greenwood Elementary School
(Math: 70-74% | Reading: 80-84%)
Rank:
Rank:
10/
Top 5%10
144 Nw 80 St
Seattle, WA 98117
(206) 252-1400
Seattle, WA 98117
(206) 252-1400
Grades: PK-5
| 324 students
Rank: #18 - 1918. - 19.
Mcgilvra Elementary School
(Math: 75-79% | Reading: 75-79%)
Rank:
Rank:
10/
Top 10%10
1617 38 Av E
Seattle, WA 98112
(206) 252-3160
Seattle, WA 98112
(206) 252-3160
Grades: K-5
| 215 students
Rank: #18 - 1918. - 19.
North Beach Elementary School
(Math: 75-79% | Reading: 75-79%)
Rank:
Rank:
10/
Top 10%10
9018 24 Av Nw
Seattle, WA 98117
(206) 252-1510
Seattle, WA 98117
(206) 252-1510
Grades: PK-5
| 366 students
Rank: #2020.
Hamilton International Middle School
(Math: 73% | Reading: 80%)
Rank:
Rank:
10/
Top 10%10
1610 N 41 St
Seattle, WA 98103
(206) 252-5810
Seattle, WA 98103
(206) 252-5810
Grades: 6-8
| 897 students
Rank: #2121.
Alki Elementary School
(Math: 65-69% | Reading: 80-84%)
Rank:
Rank:
10/
Top 10%10
3010 59 Av Sw
Seattle, WA 98116
(206) 252-9050
Seattle, WA 98116
(206) 252-9050
Grades: PK-5
| 270 students
Rank: #22 - 2322. - 23.
Daniel Bagley Elementary School
(Math: 70-74% | Reading: 75-79%)
Rank:
Rank:
10/
Top 10%10
7821 Stone Av N
Seattle, WA 98103
(206) 252-5110
Seattle, WA 98103
(206) 252-5110
Grades: K-5
| 317 students
Rank: #22 - 2322. - 23.
Whittier Elementary School
(Math: 70-74% | Reading: 75-79%)
Rank:
Rank:
10/
Top 10%10
1320 Nw 75 St
Seattle, WA 98117
(206) 252-1650
Seattle, WA 98117
(206) 252-1650
Grades: K-5
| 342 students
Rank: #2424.
Madison Middle School
(Math: 65% | Reading: 78%)
Rank:
Rank:
10/
Top 10%10
3429 45th Ave Sw
Seattle, WA 98116
(206) 252-9200
Seattle, WA 98116
(206) 252-9200
Grades: 6-8
| 1,020 students
Rank: #2525.
Hazel Wolf K-8
(Math: 70% | Reading: 74%)
Rank:
Rank:
10/
Top 10%10
11530 12th Ave. Ne
Seattle, WA 98125
(206) 252-4500
Seattle, WA 98125
(206) 252-4500
Grades: K-8
| 731 students
Rank: #2626.
Genesee Hill Elementary School
(Math: 68% | Reading: 74%)
Rank:
Rank:
10/
Top 10%10
5013 Sw Dakota Street
Seattle, WA 98116
(206) 252-9700
Seattle, WA 98116
(206) 252-9700
Grades: K-5
| 477 students
Rank: #2727.
John Hay Elementary School
(Math: 60-64% | Reading: 75-79%)
Rank:
Rank:
10/
Top 10%10
201 Garfield St
Seattle, WA 98109
(206) 252-2100
Seattle, WA 98109
(206) 252-2100
Grades: K-5
| 264 students
Rank: #2828.
West Seattle High School
(Math: 54% | Reading: 89%)
Rank:
Rank:
10/
Top 10%10
3000 California Av Sw
Seattle, WA 98116
(206) 252-8800
Seattle, WA 98116
(206) 252-8800
Grades: 9-12
| 1,392 students
Rank: #29 - 3029. - 30.
Thornton Creek Elementary School
Alternative School
(Math: 68% | Reading: 73%)
Rank:
Rank:
10/
Top 10%10
7712 40th Ave Ne
Seattle, WA 98115
(206) 252-5300
Seattle, WA 98115
(206) 252-5300
Grades: PK-5
| 453 students
Rank: #29 - 3029. - 30.
Thurgood Marshall Elementary School
(Math: 68% | Reading: 73%)
Rank:
Rank:
10/
Top 10%10
2401 S Irving St
Seattle, WA 98144
(206) 252-2800
Seattle, WA 98144
(206) 252-2800
Grades: PK-5
| 468 students
Rank: #3131.
Whitman Middle School
(Math: 64% | Reading: 75%)
Rank:
Rank:
10/
Top 10%10
9201 15 Av Nw
Seattle, WA 98117
(206) 252-1200
Seattle, WA 98117
(206) 252-1200
Grades: 6-8
| 660 students
Rank: #3232.
Fairmount Park Elementary School
(Math: 66% | Reading: 74%)
Rank:
Rank:
10/
Top 10%10
3800 Sw Findlay St
Seattle, WA 98126
(206) 252-9290
Seattle, WA 98126
(206) 252-9290
Grades: PK-5
| 392 students
Rank: #33 - 3433. - 34.
B F Day Elementary School
(Math: 65-69% | Reading: 70-74%)
Rank:
Rank:
9/
Top 20%10
3921 Linden Av N
Seattle, WA 98103
(206) 252-6010
Seattle, WA 98103
(206) 252-6010
Grades: PK-5
| 414 students
Rank: #33 - 3433. - 34.
Queen Anne Elementary School
(Math: 65-69% | Reading: 70-74%)
Rank:
Rank:
9/
Top 20%10
411 Boston St.
Seattle, WA 98109
(206) 252-2480
Seattle, WA 98109
(206) 252-2480
Grades: K-5
| 215 students
Rank: #3535.
Pathfinder K-8 School
Alternative School
(Math: 65% | Reading: 74%)
Rank:
Rank:
9/
Top 20%10
1901 Sw Genesee St
Seattle, WA 98106
(206) 252-9710
Seattle, WA 98106
(206) 252-9710
Grades: K-8
| 448 students
Show 74 more public schools in Seattle School District No. 1 (out of 109 total schools)
Loading...
Frequently Asked Questions
How many schools belong to Seattle School District No. 1?
Seattle School District No. 1 manages 109 public schools serving 50,770 students.
What is the rank of Seattle School District No. 1?
Seattle School District No. 1 is ranked #26 out of 306 school districts in Washington (top 10%) based off of combined math and reading proficiency testing data for the 2021-2022 school year. This district ranks in the top 20% of Washington school districts for: Highest overall rank (Top 10%), Highest math proficiency (Top 10%), Highest reading/language arts proficiency (Top 20%), Highest science proficiency (Top 20%), Most diverse schools (Top 1%) and Largest student body (number of students) (Top 1%)
What is the racial composition of students in Seattle School District No. 1?
44% of Seattle School District No. 1 students are White, 14% of students are Hispanic, 14% of students are Black, 13% of students are Asian, 13% of students are Two or more races, 1% of students are American Indian, and 1% of students are Hawaiian.
What is the student/teacher ratio of Seattle School District No. 1?
Seattle School District No. 1 has a student/teacher ratio of 17:1, which is lower than the Washington state average of 18:1.
What is Seattle School District No. 1's spending/student ratio?
The school district's spending/student of $21,949 is higher than the state median of $19,246. The school district spending/student has grown by 6% over four school years.
Recent Articles

Year-Round Or Traditional Schedule?
Which is more appropriate for your child? A year-round attendance schedule or traditional schedule? We look at the pros and cons.

Why You Should Encourage Your Child to Join a Sports Team
Participating in team sports has a great many benefits for children, there is no doubt. In this article you will learn what those benefits are.

White Students are Now the Minority in U.S. Public Schools
Increasing birth rates among immigrant families from Asia and Central and South America, combined with lower birth rates among white families, means that for the first time in history, public school students in the United States are majority-minority. This shift in demographics poses difficulties for schools as they work to accommodate children of varying language abilities and socio-economic backgrounds.


