Top Rankings
Seattle School District No. 1 ranks among the top 20% of public school district in Washington for:
Category
Attribute
Overall Rank
Highest overall rank (Top 10%)
Math Proficiency
Highest math proficiency (Top 10%)
Reading/Language Arts Proficiency
Highest reading/language arts proficiency (Top 20%)
Science Proficiency
Highest science proficiency (Top 20%)
Diversity
Most diverse schools (Top 1%)
Community Size
Largest student body (number of students) (Top 1%)
For the 2025 school year, there are 43 public preschools serving 14,113 students in Seattle School District No. 1. This district's average pre testing ranking is 8/10, which is in the top 30% of public pre schools in Washington.
Public Preschools in Seattle School District No. 1 have an average math proficiency score of 49% (versus the Washington public pre school average of 43%), and reading proficiency score of 56% (versus the 49% statewide average).
Minority enrollment is 63% of the student body (majority Black and Hispanic), which is more than the Washington public preschool average of 54% (majority Hispanic).
Overview
This School District
This State (WA)
# Schools
109 Schools
801 Schools
# Students
50,770 Students
280,418 Students
# Teachers
3,031 Teachers
17,799 Teachers
Student : Teacher Ratio
17:1
17:1
District Rank
Seattle School District No. 1, which is ranked within the top 10% of all 306 school districts in Washington (based off of combined math and reading proficiency testing data) for the 2021-2022 school year.
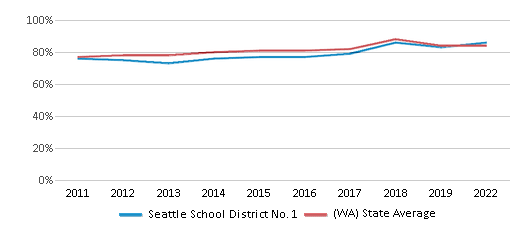
The school district's graduation rate of 86% has increased from 77% over five school years.
Overall District Rank
#26 out of 307 school districts
(Top 10%)
(Top 10%)
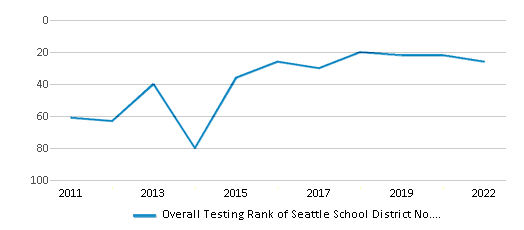
Math Test Scores (% Proficient)
56%
40%
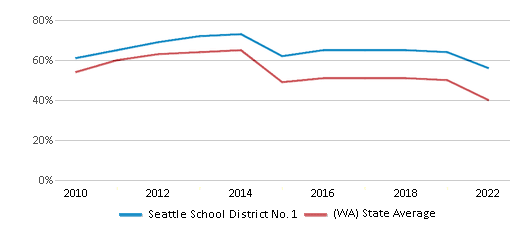
Reading/Language Arts Test Scores (% Proficient)
67%
53%
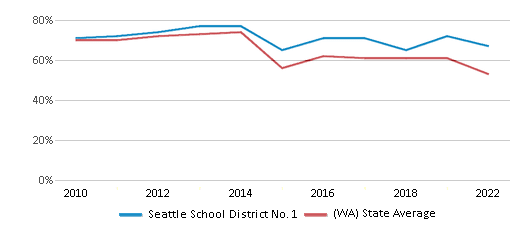
Science Test Scores (% Proficient)
61%
49%
Graduation Rate
86%
84%
Students by Ethnicity:
Diversity Score
0.74
0.71
# American Indian Students
224 Students
2,844 Students
% American Indian Students
1%
1%
# Asian Students
6,314 Students
25,971 Students
% Asian Students
13%
9%
# Hispanic Students
7,311 Students
73,094 Students
% Hispanic Students
14%
26%
# Black Students
7,135 Students
16,473 Students
% Black Students
14%
6%
# White Students
22,531 Students
129,086 Students
% White Students
44%
46%
# Hawaiian Students
258 Students
5,103 Students
% Hawaiian Students
1%
2%
# Two or more races Students
6,347 Students
27,229 Students
% of Two or more races Students
13%
10%
Students by Grade:
# Students in PK Grade:
1,105
23,952
# Students in K Grade:
3,705
43,573
# Students in 1st Grade:
3,891
42,048
# Students in 2nd Grade:
3,987
43,955
# Students in 3rd Grade:
3,683
39,809
# Students in 4th Grade:
3,967
41,098
# Students in 5th Grade:
3,940
39,252
# Students in 6th Grade:
3,534
3,085
# Students in 7th Grade:
3,467
1,010
# Students in 8th Grade:
3,589
1,067
# Students in 9th Grade:
3,785
319
# Students in 10th Grade:
3,837
337
# Students in 11th Grade:
4,089
333
# Students in 12th Grade:
4,191
580
# Ungraded Students:
-
-
District Revenue and Spending
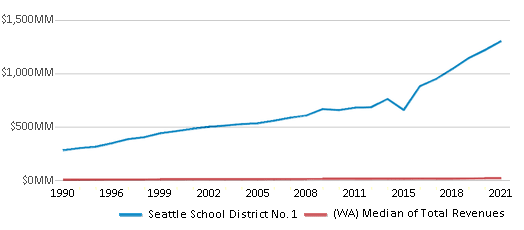
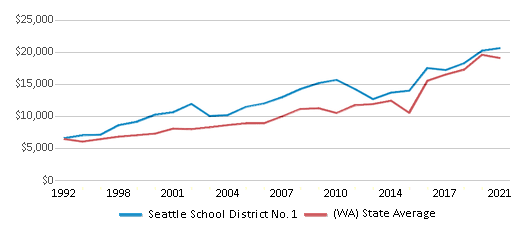
The revenue/student of $25,664 is higher than the state median of $18,796. The school district revenue/student has grown by 6% over four school years.
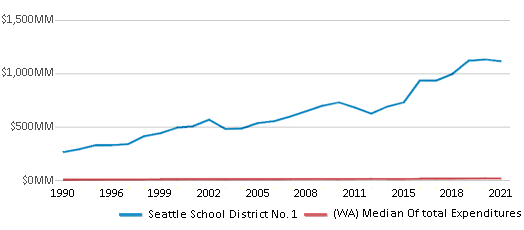
The school district's spending/student of $21,949 is higher than the state median of $19,246. The school district spending/student has grown by 6% over four school years.
Total Revenue
$1,303 MM
$20,715 MM
Spending
$1,114 MM
$21,212 MM
Revenue / Student
$25,664
$18,796
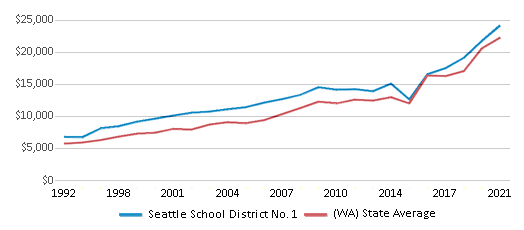
Spending / Student
$21,949
$19,246
Best Seattle School District No. 1 Public Preschools (2025)
School
(Math and Reading Proficiency)
(Math and Reading Proficiency)
Location
Grades
Students
Rank: #11.
View Ridge Elementary School
(Math: 80-84% | Reading: 85-89%)
Rank:
Rank:
10/
Top 5%10
7047 50 Av Ne
Seattle, WA 98115
(206) 252-5600
Seattle, WA 98115
(206) 252-5600
Grades: PK-5
| 282 students
Rank: #22.
Greenwood Elementary School
(Math: 70-74% | Reading: 80-84%)
Rank:
Rank:
10/
Top 5%10
144 Nw 80 St
Seattle, WA 98117
(206) 252-1400
Seattle, WA 98117
(206) 252-1400
Grades: PK-5
| 324 students
Rank: #33.
North Beach Elementary School
(Math: 75-79% | Reading: 75-79%)
Rank:
Rank:
10/
Top 10%10
9018 24 Av Nw
Seattle, WA 98117
(206) 252-1510
Seattle, WA 98117
(206) 252-1510
Grades: PK-5
| 366 students
Rank: #44.
Alki Elementary School
(Math: 65-69% | Reading: 80-84%)
Rank:
Rank:
10/
Top 10%10
3010 59 Av Sw
Seattle, WA 98116
(206) 252-9050
Seattle, WA 98116
(206) 252-9050
Grades: PK-5
| 270 students
Rank: #5 - 65. - 6.
Thornton Creek Elementary School
Alternative School
(Math: 68% | Reading: 73%)
Rank:
Rank:
10/
Top 10%10
7712 40th Ave Ne
Seattle, WA 98115
(206) 252-5300
Seattle, WA 98115
(206) 252-5300
Grades: PK-5
| 453 students
Rank: #5 - 65. - 6.
Thurgood Marshall Elementary School
(Math: 68% | Reading: 73%)
Rank:
Rank:
10/
Top 10%10
2401 S Irving St
Seattle, WA 98144
(206) 252-2800
Seattle, WA 98144
(206) 252-2800
Grades: PK-5
| 468 students
Rank: #77.
Fairmount Park Elementary School
(Math: 66% | Reading: 74%)
Rank:
Rank:
10/
Top 10%10
3800 Sw Findlay St
Seattle, WA 98126
(206) 252-9290
Seattle, WA 98126
(206) 252-9290
Grades: PK-5
| 392 students
Rank: #88.
B F Day Elementary School
(Math: 65-69% | Reading: 70-74%)
Rank:
Rank:
9/
Top 20%10
3921 Linden Av N
Seattle, WA 98103
(206) 252-6010
Seattle, WA 98103
(206) 252-6010
Grades: PK-5
| 414 students
Rank: #99.
Tops K-8 School
Alternative School
(Math: 63% | Reading: 72%)
Rank:
Rank:
9/
Top 20%10
2500 Franklin Av E
Seattle, WA 98102
(206) 252-3510
Seattle, WA 98102
(206) 252-3510
Grades: PK-8
| 471 students
Rank: #1010.
Cedar Park Elementary School
(Math: 70-74% | Reading: 65-69%)
Rank:
Rank:
9/
Top 20%10
13224 37th Ave Ne
Seattle, WA 98125
(206) 252-4300
Seattle, WA 98125
(206) 252-4300
Grades: PK-5
| 272 students
Rank: #1111.
Lafayette Elementary School
(Math: 65-69% | Reading: 65-69%)
Rank:
Rank:
9/
Top 20%10
2645 California Av Sw
Seattle, WA 98116
(206) 252-9500
Seattle, WA 98116
(206) 252-9500
Grades: PK-5
| 504 students
Rank: #1212.
Hawthorne Elementary School
(Math: 60-64% | Reading: 60-64%)
Rank:
Rank:
9/
Top 20%10
4100 39 Av S
Seattle, WA 98118
(206) 252-7210
Seattle, WA 98118
(206) 252-7210
Grades: PK-5
| 374 students
Rank: #13 - 1413. - 14.
Green Lake Elementary School
(Math: 55-59% | Reading: 60-64%)
Rank:
Rank:
8/
Top 30%10
2400 N 65 St
Seattle, WA 98103
(206) 252-5320
Seattle, WA 98103
(206) 252-5320
Grades: PK-5
| 322 students
Rank: #13 - 1413. - 14.
Magnolia Elementary School
(Math: 55-59% | Reading: 60-64%)
Rank:
Rank:
8/
Top 30%10
2418 24th Ave W
Seattle, WA 98199
(206) 743-3800
Seattle, WA 98199
(206) 743-3800
Grades: PK-5
| 338 students
Rank: #1515.
Viewlands Elementary School
(Math: 60-64% | Reading: 55-59%)
Rank:
Rank:
8/
Top 30%10
10525 3 Av Nw
Seattle, WA 98177
(206) 252-4400
Seattle, WA 98177
(206) 252-4400
Grades: PK-5
| 267 students
Rank: #1616.
Sacajawea Elementary School
(Math: 50-54% | Reading: 55-59%)
Rank:
Rank:
8/
Top 30%10
9501 20 Av Ne
Seattle, WA 98115
(206) 252-5550
Seattle, WA 98115
(206) 252-5550
Grades: PK-5
| 228 students
Rank: #1717.
Arbor Heights Elementary School
(Math: 47% | Reading: 65%)
Rank:
Rank:
8/
Top 30%10
3701 Sw 104th Street
Seattle, WA 98146
(206) 252-9250
Seattle, WA 98146
(206) 252-9250
Grades: PK-5
| 511 students
Rank: #1818.
West Seattle Elementary School
(Math: 50-54% | Reading: 50-54%)
Rank:
Rank:
7/
Top 50%10
6760 34 Av Sw
Seattle, WA 98126
(206) 252-9450
Seattle, WA 98126
(206) 252-9450
Grades: PK-5
| 374 students
Rank: #1919.
James Baldwin Elementary School
(Math: 40-44% | Reading: 55-59%)
Rank:
Rank:
7/
Top 50%10
11725 1 Av Ne
Seattle, WA 98125
(206) 252-4180
Seattle, WA 98125
(206) 252-4180
Grades: PK-5
| 233 students
Rank: #2020.
Wing Luke Elementary School
(Math: 45-49% | Reading: 50-54%)
Rank:
Rank:
7/
Top 50%10
3701 S Kenyon St
Seattle, WA 98118
(206) 252-7630
Seattle, WA 98118
(206) 252-7630
Grades: PK-5
| 315 students
Rank: #2121.
Sand Point Elementary School
(Math: 40-44% | Reading: 50-54%)
Rank:
Rank:
6/
Top 50%10
6208 60 Ave Ne
Seattle, WA 98115
(206) 252-2100
Seattle, WA 98115
(206) 252-2100
Grades: PK-5
| 213 students
Rank: #2222.
Dearborn Park International School
(Math: 55-59% | Reading: 40-44%)
Rank:
Rank:
6/
Top 50%10
2820 S Orcas St
Seattle, WA 98108
(206) 252-6930
Seattle, WA 98108
(206) 252-6930
Grades: PK-5
| 326 students
Rank: #2323.
Broadview-thomson K-8 School
(Math: 40% | Reading: 53%)
Rank:
Rank:
6/
Top 50%10
13052 Greenwood Av N
Seattle, WA 98133
(206) 252-4080
Seattle, WA 98133
(206) 252-4080
Grades: PK-8
| 564 students
Rank: #2424.
Olympic Hills Elementary School
(Math: 45-49% | Reading: 45-49%)
Rank:
Rank:
6/
Top 50%10
13018 20 Av Ne
Seattle, WA 98125
(206) 252-4300
Seattle, WA 98125
(206) 252-4300
Grades: PK-5
| 485 students
Rank: #2525.
Rainier View Elementary School
(Math: 35-39% | Reading: 45-49%)
Rank:
Rank:
5/
Bottom 50%10
11650 Beacon Av S
Seattle, WA 98178
(206) 252-6700
Seattle, WA 98178
(206) 252-6700
Grades: PK-5
| 200 students
Rank: #26 - 2726. - 27.
Graham Hill Elementary School
(Math: 40-44% | Reading: 40-44%)
Rank:
Rank:
5/
Bottom 50%10
5149 S Graham St
Seattle, WA 98118
(206) 252-7140
Seattle, WA 98118
(206) 252-7140
Grades: PK-5
| 242 students
Rank: #26 - 2726. - 27.
Highland Park Elementary School
(Math: 40-44% | Reading: 40-44%)
Rank:
Rank:
5/
Bottom 50%10
1012 Sw Trenton St
Seattle, WA 98106
(206) 252-8240
Seattle, WA 98106
(206) 252-8240
Grades: PK-5
| 283 students
Rank: #2828.
Louisa Boren Stem K-8
Magnet School
(Math: 34% | Reading: 48%)
Rank:
Rank:
5/
Bottom 50%10
5950 Delridge Way Sw
Seattle, WA 98106
(206) 252-8450
Seattle, WA 98106
(206) 252-8450
Grades: PK-8
| 457 students
Rank: #29 - 3029. - 30.
Kimball Elementary School
(Math: 35-39% | Reading: 40-44%)
Rank:
Rank:
4/
Bottom 50%10
3200 23 Av S
Seattle, WA 98144
(206) 252-7280
Seattle, WA 98144
(206) 252-7280
Grades: PK-5
| 415 students
Rank: #29 - 3029. - 30.
Lowell Elementary School
(Math: 35-39% | Reading: 40-44%)
Rank:
Rank:
4/
Bottom 50%10
1058 E Mercer St
Seattle, WA 98102
(206) 252-3020
Seattle, WA 98102
(206) 252-3020
Grades: PK-5
| 382 students
Rank: #3131.
Bridges Transition
Special Education School
(Math: <50% | Reading: <50% )
Rank:
Rank:
4/
Bottom 50%10
7201 Beacon Ave S
Seattle, WA 98108
(206) 252-0058
Seattle, WA 98108
(206) 252-0058
Grades: PK-12
| 118 students
Rank: #32 - 3332. - 33.
Dunlap Elementary School
(Math: 30-34% | Reading: 45-49%)
Rank:
Rank:
4/
Bottom 50%10
4525 S Cloverdale St
Seattle, WA 98118
(206) 252-7000
Seattle, WA 98118
(206) 252-7000
Grades: PK-5
| 248 students
Rank: #32 - 3332. - 33.
Licton Springs K-8
Alternative School
(Math: 30-34% | Reading: 45-49%)
Rank:
Rank:
4/
Bottom 50%10
3015 Nw 68th St.
Seattle, WA 98117
(206) 743-3700
Seattle, WA 98117
(206) 743-3700
Grades: PK-8
| 119 students
Rank: #3434.
South Shore Pk-8 School
(Math: 30% | Reading: 45%)
Rank:
Rank:
4/
Bottom 50%10
4800 S Henderson St
Seattle, WA 98118
(206) 252-7600
Seattle, WA 98118
(206) 252-7600
Grades: PK-8
| 570 students
Rank: #35 - 3635. - 36.
Martin Luther King Jr. Elementary School
(Math: 30-34% | Reading: 35-39%)
Rank:
Rank:
3/
Bottom 50%10
6725 45 Ave S
Seattle, WA 98118
(206) 252-6770
Seattle, WA 98118
(206) 252-6770
Grades: PK-5
| 281 students
Show 8 more public schools in Seattle School District No. 1 (out of 43 total schools)
Loading...
Recent Articles

Year-Round Or Traditional Schedule?
Which is more appropriate for your child? A year-round attendance schedule or traditional schedule? We look at the pros and cons.

Why You Should Encourage Your Child to Join a Sports Team
Participating in team sports has a great many benefits for children, there is no doubt. In this article you will learn what those benefits are.

White Students are Now the Minority in U.S. Public Schools
Increasing birth rates among immigrant families from Asia and Central and South America, combined with lower birth rates among white families, means that for the first time in history, public school students in the United States are majority-minority. This shift in demographics poses difficulties for schools as they work to accommodate children of varying language abilities and socio-economic backgrounds.


