Top Rankings
Williamson County School District ranks among the top 20% of public school district in Tennessee for:
Category
Attribute
Overall Rank
Highest overall rank (Top 1%)
Math Proficiency
Highest math proficiency (Top 1%)
Reading/Language Arts Proficiency
Highest reading/language arts proficiency (Top 1%)
Science Proficiency
Highest science proficiency (Top 1%)
Graduation Rate
Highest graduation rate (Top 5%)
Community Size
Largest student body (number of students) (Top 1%)
For the 2025 school year, there are 41 public elementary schools serving 27,581 students in Williamson County School District. This district's average elementary testing ranking is 10/10, which is in the top 1% of public elementary schools in Tennessee.
Public Elementary Schools in Williamson County School District have an average math proficiency score of 71% (versus the Tennessee public elementary school average of 35%), and reading proficiency score of 67% (versus the 36% statewide average).
The top ranked public elementary schools in Williamson County School District are Clovercroft Elementary School, Jordan Elementary School and Brentwood Middle School. Overall testing rank is based on a school's combined math and reading proficiency test score ranking. Minority enrollment is 24% of the student body (majority Asian and Hispanic), which is less than the Tennessee public elementary school average of 43% (majority Black).
Overview
This School District
This State (TN)
# Schools
52 Schools
1,500 Schools
# Students
41,909 Students
719,413 Students
# Teachers
2,717 Teachers
48,388 Teachers
Student : Teacher Ratio
15:1
15:1
District Rank
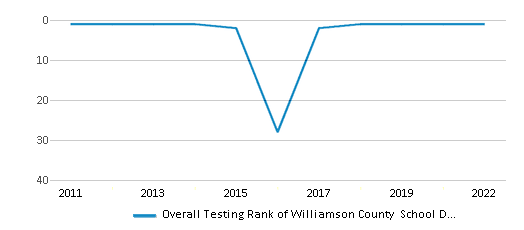
Williamson County School District, which is ranked within the top 1% of all 147 school districts in Tennessee (based off of combined math and reading proficiency testing data) for the 2021-2022 school year.
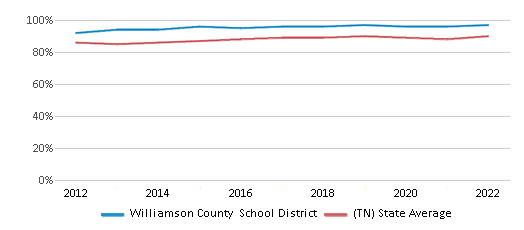
The school district's graduation rate of 97% has increased from 96% over five school years.
Overall District Rank
#1 out of 147 school districts
(Top 1%)
(Top 1%)
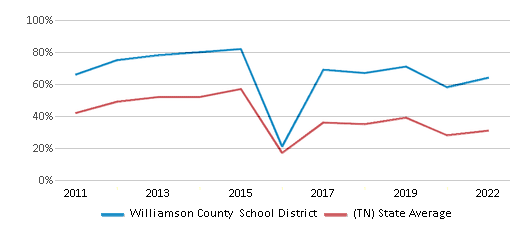
Math Test Scores (% Proficient)
64%
31%
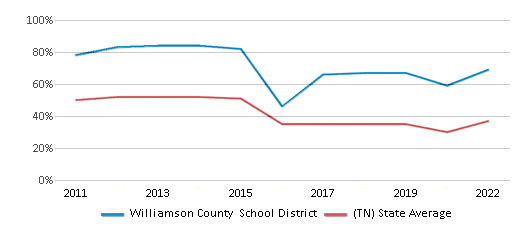
Reading/Language Arts Test Scores (% Proficient)
69%
37%
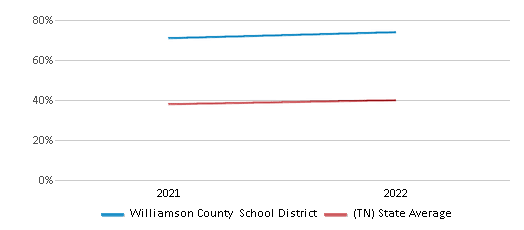
Science Test Scores (% Proficient)
74%
40%
Graduation Rate
97%
90%
Students by Ethnicity:
Diversity Score
0.41
0.61
# American Indian Students
71 Students
1,225 Students
% American Indian Students
n/a
n/a
# Asian Students
3,430 Students
15,029 Students
% Asian Students
8%
2%
# Hispanic Students
3,290 Students
106,507 Students
% Hispanic Students
8%
15%
# Black Students
1,382 Students
149,772 Students
% Black Students
3%
21%
# White Students
31,780 Students
410,765 Students
% White Students
76%
57%
# Hawaiian Students
29 Students
856 Students
% Hawaiian Students
n/a
n/a
# Two or more races Students
1,927 Students
35,256 Students
% of Two or more races Students
5%
5%
Students by Grade:
# Students in PK Grade:
602
29,574
# Students in K Grade:
2,547
74,511
# Students in 1st Grade:
2,723
76,014
# Students in 2nd Grade:
2,916
77,971
# Students in 3rd Grade:
3,040
74,743
# Students in 4th Grade:
3,108
75,052
# Students in 5th Grade:
3,163
75,941
# Students in 6th Grade:
3,166
75,064
# Students in 7th Grade:
3,163
70,062
# Students in 8th Grade:
3,153
69,763
# Students in 9th Grade:
3,502
5,469
# Students in 10th Grade:
3,632
5,392
# Students in 11th Grade:
3,633
4,910
# Students in 12th Grade:
3,561
4,947
# Ungraded Students:
-
-
District Revenue and Spending
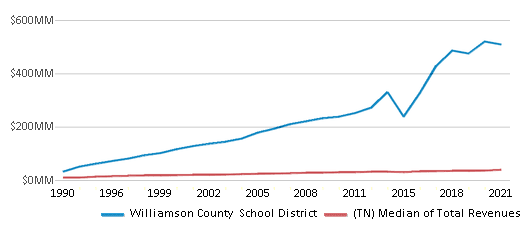
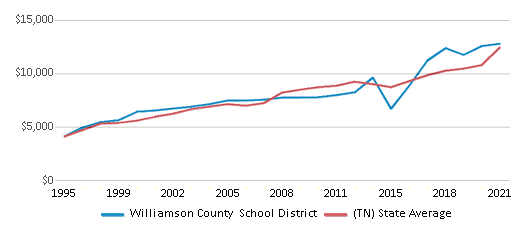
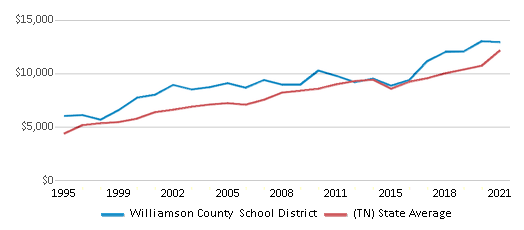
The revenue/student of $12,146 is higher than the state median of $11,979. The school district revenue/student has stayed relatively flat over four school years.
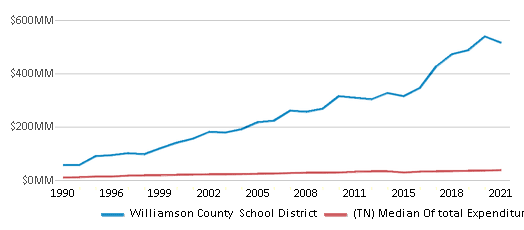
The school district's spending/student of $12,287 is higher than the state median of $11,478. The school district spending/student has stayed relatively flat over four school years.
Total Revenue
$509 MM
$12,104 MM
Spending
$515 MM
$11,597 MM
Revenue / Student
$12,146
$11,979
Spending / Student
$12,287
$11,478
Best Williamson County School District Public Elementary Schools (2025)
School
(Math and Reading Proficiency)
(Math and Reading Proficiency)
Location
Grades
Students
Rank: #11.
Clovercroft Elementary School
(Math: 90% | Reading: 87%)
Rank:
Rank:
10/
Top 1%10
9336 Clovercroft Rd
Franklin, TN 37067
(615) 472-5170
Franklin, TN 37067
(615) 472-5170
Grades: K-5
| 680 students
Rank: #22.
Jordan Elementary School
(Math: 88% | Reading: 82%)
Rank:
Rank:
10/
Top 1%10
9714 Split Log Rd
Brentwood, TN 37027
(615) 472-5270
Brentwood, TN 37027
(615) 472-5270
Grades: PK-5
| 632 students
Rank: #33.
Brentwood Middle School
(Math: 84% | Reading: 80%)
Rank:
Rank:
10/
Top 1%10
5324 Murray Ln
Brentwood, TN 37027
(615) 472-4250
Brentwood, TN 37027
(615) 472-4250
Grades: 6-8
| 1,126 students
Rank: #44.
Grassland Elementary School
(Math: 85% | Reading: 79%)
Rank:
Rank:
10/
Top 1%10
6803 Manley Ln
Brentwood, TN 37027
(615) 472-4480
Brentwood, TN 37027
(615) 472-4480
Grades: K-5
| 463 students
Rank: #55.
Crockett Elementary School
(Math: 81% | Reading: 80%)
Rank:
Rank:
10/
Top 5%10
9019 Crockett Rd
Brentwood, TN 37027
(615) 472-4340
Brentwood, TN 37027
(615) 472-4340
Grades: PK-5
| 733 students
Rank: #66.
Lipscomb Elementary School
(Math: 84% | Reading: 76%)
Rank:
Rank:
10/
Top 5%10
8011 Concord Rd
Brentwood, TN 37027
(615) 472-4650
Brentwood, TN 37027
(615) 472-4650
Grades: PK-5
| 566 students
Rank: #7 - 87. - 8.
Scales Elementary School
(Math: 80% | Reading: 75%)
Rank:
Rank:
10/
Top 5%10
6430 Murray Ln
Brentwood, TN 37027
(615) 472-4830
Brentwood, TN 37027
(615) 472-4830
Grades: K-5
| 712 students
Rank: #7 - 87. - 8.
Walnut Grove Elementary School
(Math: 77% | Reading: 77%)
Rank:
Rank:
10/
Top 5%10
326 Stable Rd
Franklin, TN 37069
(615) 472-4870
Franklin, TN 37069
(615) 472-4870
Grades: PK-5
| 586 students
Rank: #99.
Creekside Elementary School
(Math: 82% | Reading: 73%)
Rank:
Rank:
10/
Top 5%10
4239 Glossy Hill Rd
Franklin, TN 37064
(615) 472-5370
Franklin, TN 37064
(615) 472-5370
Grades: K-5
| 792 students
Rank: #1010.
Pearre Creek Elementary School
(Math: 78% | Reading: 76%)
Rank:
Rank:
10/
Top 5%10
1811 Townsend Blvd
Franklin, TN 37064
(615) 472-5150
Franklin, TN 37064
(615) 472-5150
Grades: PK-5
| 671 students
Rank: #1111.
Kenrose Elementary School
(Math: 80% | Reading: 74%)
Rank:
Rank:
10/
Top 5%10
1702 Raintree Pkwy
Brentwood, TN 37027
(615) 472-4630
Brentwood, TN 37027
(615) 472-4630
Grades: PK-5
| 701 students
Rank: #1212.
Sunset Middle School
(Math: 80% | Reading: 73%)
Rank:
Rank:
10/
Top 5%10
200 Sunset Trl
Brentwood, TN 37027
(615) 472-5020
Brentwood, TN 37027
(615) 472-5020
Grades: 6-8
| 708 students
Rank: #1313.
Fred J Page Middle School
(Math: 74% | Reading: 76%)
Rank:
Rank:
10/
Top 5%10
6262 Arno Rd
Franklin, TN 37064
(615) 472-4760
Franklin, TN 37064
(615) 472-4760
Grades: 6-8
| 1,308 students
Rank: #1414.
Oak View Elementary School
(Math: 77% | Reading: 74%)
Rank:
Rank:
10/
Top 5%10
2390 Henpeck Ln
Franklin, TN 37064
(615) 472-4710
Franklin, TN 37064
(615) 472-4710
Grades: PK-5
| 534 students
Rank: #1515.
Woodland Middle School
(Math: 73% | Reading: 75%)
Rank:
Rank:
10/
Top 5%10
1500 Volunteer Pkwy
Brentwood, TN 37027
(615) 472-4930
Brentwood, TN 37027
(615) 472-4930
Grades: 6-8
| 957 students
Rank: #16 - 1716. - 17.
Edmondson Elementary School
(Math: 79% | Reading: 71%)
Rank:
Rank:
10/
Top 5%10
851 Edmondson Pike
Brentwood, TN 37027
(615) 472-4360
Brentwood, TN 37027
(615) 472-4360
Grades: K-5
| 651 students
Rank: #16 - 1716. - 17.
Trinity Elementary School
(Math: 75% | Reading: 72%)
Rank:
Rank:
10/
Top 5%10
4410 Murfreesboro Rd
Franklin, TN 37067
(615) 472-4850
Franklin, TN 37067
(615) 472-4850
Grades: PK-5
| 765 students
Rank: #1818.
Winstead Elementary School
(Math: 74% | Reading: 71%)
Rank:
Rank:
10/
Top 5%10
4080 Columbia Pike
Franklin, TN 37064
(615) 472-4910
Franklin, TN 37064
(615) 472-4910
Grades: PK-5
| 632 students
Rank: #1919.
Hunters Bend Elementary School
(Math: 70% | Reading: 75%)
Rank:
Rank:
10/
Top 5%10
2121 Fieldstone Pkwy
Franklin, TN 37069
(615) 472-4580
Franklin, TN 37069
(615) 472-4580
Grades: K-5
| 371 students
Rank: #2020.
Mill Creek Middle School
(Math: 68% | Reading: 69%)
Rank:
Rank:
10/
Top 5%10
200 York Trl
Nolensville, TN 37135
(615) 472-5250
Nolensville, TN 37135
(615) 472-5250
Grades: 6-8
| 914 students
Rank: #2121.
Mill Creek Elementary School
(Math: 79% | Reading: 62%)
Rank:
Rank:
10/
Top 5%10
100 York Trl
Nolensville, TN 37135
(615) 472-5230
Nolensville, TN 37135
(615) 472-5230
Grades: K-5
| 702 students
Rank: #2222.
Bethesda Elementary School
(Math: 74% | Reading: 62%)
Rank:
Rank:
10/
Top 5%10
4907 Bethesda Rd
Thompsons Station, TN 37179
(615) 472-4200
Thompsons Station, TN 37179
(615) 472-4200
Grades: PK-5
| 545 students
Rank: #2323.
College Grove Elementary School
(Math: 71% | Reading: 62%)
Rank:
Rank:
10/
Top 5%10
6668 Arno-college Grove
College Grove, TN 37046
(615) 472-4320
College Grove, TN 37046
(615) 472-4320
Grades: PK-5
| 400 students
Rank: #2424.
Grassland Middle School
(Math: 67% | Reading: 64%)
Rank:
Rank:
10/
Top 5%10
2390 Hillsboro Rd
Franklin, TN 37064
(615) 472-4500
Franklin, TN 37064
(615) 472-4500
Grades: 6-8
| 831 students
Rank: #2525.
Legacy Middle School
(Math: 61% | Reading: 68%)
Rank:
Rank:
10/
Top 10%10
2380 Henpeck Ln
Franklin, TN 37064
(615) 472-4000
Franklin, TN 37064
(615) 472-4000
Grades: 6-8
| 552 students
Rank: #2626.
Nolensville Elementary School
(Math: 68% | Reading: 58%)
Rank:
Rank:
10/
Top 10%10
2338 Rocky Fork Rd
Nolensville, TN 37135
(615) 472-4690
Nolensville, TN 37135
(615) 472-4690
Grades: PK-5
| 888 students
Rank: #2727.
Hillsboro Elementary/ Middle School
(Math: 61% | Reading: 63%)
Rank:
Rank:
10/
Top 10%10
5412 Pinewood Rd
Franklin, TN 37064
(615) 472-4560
Franklin, TN 37064
(615) 472-4560
Grades: PK-8
| 501 students
Rank: #2828.
Thompson's Station Elementary School
(Math: 67% | Reading: 57%)
Rank:
Rank:
10/
Top 10%10
2640 Clayton Arnold Rd
Thompsons Station, TN 37179
(615) 472-5330
Thompsons Station, TN 37179
(615) 472-5330
Grades: K-5
| 753 students
Rank: #2929.
Sunset Elementary School
(Math: 63% | Reading: 59%)
Rank:
Rank:
10/
Top 10%10
100 Sunset Trl
Brentwood, TN 37027
(615) 472-5020
Brentwood, TN 37027
(615) 472-5020
Grades: PK-5
| 591 students
Rank: #3030.
Longview Elementary School
(Math: 64% | Reading: 57%)
Rank:
Rank:
10/
Top 10%10
2929 Commonwealth Dr
Spring Hill, TN 37174
(615) 472-5060
Spring Hill, TN 37174
(615) 472-5060
Grades: PK-5
| 681 students
Rank: #3131.
Allendale Elementary School
(Math: 61% | Reading: 60%)
Rank:
Rank:
10/
Top 10%10
2100 Prescott Way
Spring Hill, TN 37174
(615) 472-5130
Spring Hill, TN 37174
(615) 472-5130
Grades: PK-5
| 600 students
Rank: #3232.
Heritage Elementary School
(Math: 63% | Reading: 57%)
Rank:
Rank:
10/
Top 10%10
4801 Columbia Pike
Thompsons Station, TN 37179
(615) 472-4520
Thompsons Station, TN 37179
(615) 472-4520
Grades: PK-5
| 570 students
Rank: #3333.
Heritage Middle School
(Math: 60% | Reading: 61%)
Rank:
Rank:
10/
Top 10%10
4803 Columbia Pike
Thompsons Station, TN 37179
(615) 472-4540
Thompsons Station, TN 37179
(615) 472-4540
Grades: 6-8
| 822 students
Rank: #3434.
Thompson's Station Middle School
(Math: 58% | Reading: 60%)
Rank:
Rank:
10/
Top 10%10
2638 Clayton Arnold Rd
Thompsons Station, TN 37179
(615) 472-5350
Thompsons Station, TN 37179
(615) 472-5350
Grades: 6-8
| 566 students
Rank: #3535.
Westwood Elementary School
(Math: 61% | Reading: 54%)
Rank:
Rank:
10/
Top 10%10
7200 Tiger Trl
Fairview, TN 37062
(615) 472-4890
Fairview, TN 37062
(615) 472-4890
Grades: PK-5
| 559 students
Show 6 more public schools in Williamson County School District (out of 41 total schools)
Loading...
Recent Articles

Year-Round Or Traditional Schedule?
Which is more appropriate for your child? A year-round attendance schedule or traditional schedule? We look at the pros and cons.

Why You Should Encourage Your Child to Join a Sports Team
Participating in team sports has a great many benefits for children, there is no doubt. In this article you will learn what those benefits are.

White Students are Now the Minority in U.S. Public Schools
Increasing birth rates among immigrant families from Asia and Central and South America, combined with lower birth rates among white families, means that for the first time in history, public school students in the United States are majority-minority. This shift in demographics poses difficulties for schools as they work to accommodate children of varying language abilities and socio-economic backgrounds.


