Top Rankings
New York City Geographic District #29 School District ranks among the top 20% of public school district in New York for:
Category
Attribute
Diversity
Most diverse schools (Top 1%)
Community Size
Largest student body (number of students) (Top 1%)
For the 2025 school year, there are 17 public middle schools serving 9,407 students in New York City Geographic District #29 School District. This district's average middle testing ranking is 3/10, which is in the bottom 50% of public middle schools in New York.
Public Middle Schools in New York City Geographic District #29 School District have an average math proficiency score of 21% (versus the New York public middle school average of 40%), and reading proficiency score of 46% (versus the 51% statewide average).
Minority enrollment is 99% of the student body (majority Black), which is more than the New York public middle school average of 63% (majority Hispanic).
Overview
This School District
This State (NY)
# Schools
46 Schools
1,659 Schools
# Students
21,752 Students
890,054 Students
# Teachers
1,738 Teachers
83,739 Teachers
Student : Teacher Ratio
13:1
13:1
District Rank
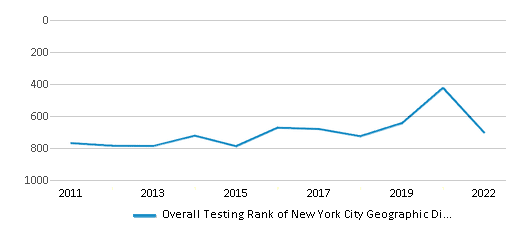
New York City Geographic District #29 School District, which is ranked #725 of all 1,015 school districts in New York (based off of combined math and reading proficiency testing data) for the 2021-2022 school year.
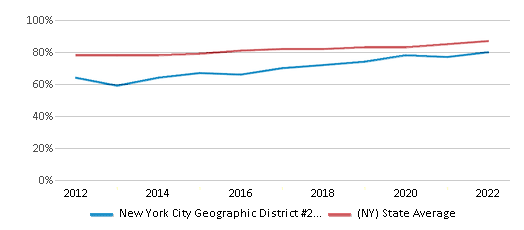
The school district's graduation rate of 80% has increased from 70% over five school years.
Overall District Rank
#704 out of 1020 school districts
(Bottom 50%)
(Bottom 50%)
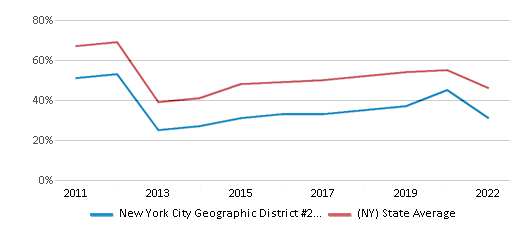
Math Test Scores (% Proficient)
31%
46%
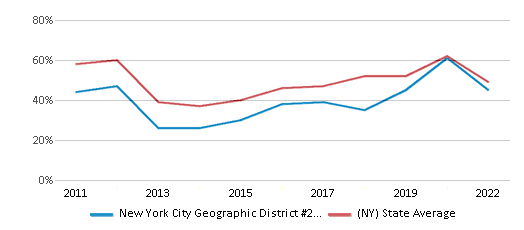
Reading/Language Arts Test Scores (% Proficient)
45%
49%
Science Test Scores (% Proficient)
62%
78%
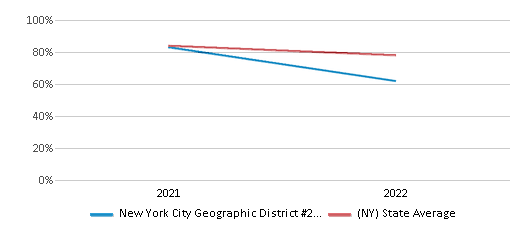
Graduation Rate
80%
87%
Students by Ethnicity:
Diversity Score
0.65
0.73
# American Indian Students
927 Students
7,222 Students
% American Indian Students
4%
1%
# Asian Students
3,748 Students
81,213 Students
% Asian Students
17%
9%
# Hispanic Students
4,737 Students
270,400 Students
% Hispanic Students
22%
30%
# Black Students
11,467 Students
175,155 Students
% Black Students
53%
20%
# White Students
296 Students
325,608 Students
% White Students
1%
37%
# Hawaiian Students
216 Students
2,099 Students
% Hawaiian Students
1%
n/a
# Two or more races Students
360 Students
28,478 Students
% of Two or more races Students
2%
3%
Students by Grade:
# Students in PK Grade:
801
8,468
# Students in K Grade:
1,642
26,528
# Students in 1st Grade:
1,765
28,304
# Students in 2nd Grade:
1,731
28,365
# Students in 3rd Grade:
1,782
27,931
# Students in 4th Grade:
1,860
29,265
# Students in 5th Grade:
1,966
43,975
# Students in 6th Grade:
1,917
157,405
# Students in 7th Grade:
1,871
185,375
# Students in 8th Grade:
2,049
188,665
# Students in 9th Grade:
1,211
40,472
# Students in 10th Grade:
1,128
36,147
# Students in 11th Grade:
1,086
33,448
# Students in 12th Grade:
908
33,009
# Ungraded Students:
35
22,697
Best New York City Geographic District #29 School District Public Middle Schools (2025)
School
(Math and Reading Proficiency)
(Math and Reading Proficiency)
Location
Grades
Students
Rank: #11.
Ps/is 295
(Math: 37% | Reading: 62%)
Rank:
Rank:
6/
Top 50%10
222-14 Jamaica Ave
Queens Village, NY 11428
(718) 464-1433
Queens Village, NY 11428
(718) 464-1433
Grades: PK-8
| 561 students
Rank: #22.
Preparatory Academy For Writers A College Board School
(Math: 32% | Reading: 65-69%)
Rank:
Rank:
6/
Top 50%10
143-10 Springfield Blvd
Springfield Gardens, NY 11413
(718) 949-8405
Springfield Gardens, NY 11413
(718) 949-8405
Grades: 6-12
| 521 students
Rank: #33.
Jean Nuzzi Intermediate School
(Math: 29% | Reading: 59%)
Rank:
Rank:
5/
Bottom 50%10
213-10 92nd Ave
Queens Village, NY 11428
(718) 465-0651
Queens Village, NY 11428
(718) 465-0651
Grades: 6-8
| 917 students
Rank: #44.
Ps/is 208
(Math: 33% | Reading: 54%)
Rank:
Rank:
5/
Bottom 50%10
74-30 Commonwlth Blvd
Bellerose, NY 11426
(718) 468-6420
Bellerose, NY 11426
(718) 468-6420
Grades: K-8
| 597 students
Rank: #55.
Queens United Middle School
(Math: 25-29% | Reading: 50-54%)
Rank:
Rank:
5/
Bottom 50%10
229-02 137th Ave
Springfield Gardens, NY 11413
(718) 723-3501
Springfield Gardens, NY 11413
(718) 723-3501
Grades: 6-8
| 221 students
Rank: #66.
Ps/is 268
(Math: 25% | Reading: 51%)
Rank:
Rank:
4/
Bottom 50%10
92-07 175th St
Jamaica, NY 11433
(718) 206-3240
Jamaica, NY 11433
(718) 206-3240
Grades: K-8
| 660 students
Rank: #77.
Gordon Parks School
(Math: 19% | Reading: 54%)
Rank:
Rank:
4/
Bottom 50%10
233-15 Merrick Blvd
Rosedale, NY 11422
(718) 341-8280
Rosedale, NY 11422
(718) 341-8280
Grades: PK-8
| 621 students
Rank: #8 - 98. - 9.
Eagle Academy For Young Men Iii
(Math: 20-24% | Reading: 40-44%)
Rank:
Rank:
3/
Bottom 50%10
171-10 Linden Blvd
Jamaica, NY 11434
(718) 480-2600
Jamaica, NY 11434
(718) 480-2600
Grades: 6-12
| 479 students
Rank: #8 - 98. - 9.
Pathways College Preparatory School A College Board School
(Math: 22% | Reading: 42%)
Rank:
Rank:
3/
Bottom 50%10
109-89 204th St
Saint Albans, NY 11412
(718) 454-4957
Saint Albans, NY 11412
(718) 454-4957
Grades: 6-12
| 715 students
Rank: #1010.
I.s. 59 Springfield Gardens
(Math: 18% | Reading: 42%)
Rank:
Rank:
3/
Bottom 50%10
132-55 Ridgedale St
Springfield Gardens, NY 11413
(718) 527-3501
Springfield Gardens, NY 11413
(718) 527-3501
Grades: 6-8
| 400 students
Rank: #1111.
I.s. 238 Susan B Anthony Academy
(Math: 20% | Reading: 41%)
Rank:
Rank:
3/
Bottom 50%10
88-15 182nd St
Hollis, NY 11423
(718) 297-9821
Hollis, NY 11423
(718) 297-9821
Grades: 6-8
| 894 students
Rank: #1212.
Collaborative Arts Middle School
(Math: 16% | Reading: 42%)
Rank:
Rank:
3/
Bottom 50%10
145-00 Springfield Blvd
Springfield Gardens, NY 11413
(718) 977-6181
Springfield Gardens, NY 11413
(718) 977-6181
Grades: 6-8
| 284 students
Rank: #1313.
I.s. 192 Linden
(Math: 13% | Reading: 35%)
Rank:
Rank:
2/
Bottom 50%10
109-89 204th St
Saint Albans, NY 11412
(718) 479-5540
Saint Albans, NY 11412
(718) 479-5540
Grades: 6-8
| 351 students
Rank: #1414.
Ps/ms 147 Ronald Mcnair
(Math: 11% | Reading: 34%)
Rank:
Rank:
2/
Bottom 50%10
218-01 116th Ave
Cambria Heights, NY 11411
(718) 528-2420
Cambria Heights, NY 11411
(718) 528-2420
Grades: PK-8
| 413 students
Rank: #1515.
Community Voices Middle School
(Math: 7% | Reading: 36%)
Rank:
Rank:
2/
Bottom 50%10
145-00 Springfield Blvd
Springfield Gardens, NY 11413
(718) 977-6180
Springfield Gardens, NY 11413
(718) 977-6180
Grades: 6-8
| 304 students
Rank: #1616.
Ps/is 116 William C Hughley
(Math: 14% | Reading: 30%)
Rank:
Rank:
2/
Bottom 50%10
107-25 Wren Pl
Jamaica, NY 11433
(718) 526-4884
Jamaica, NY 11433
(718) 526-4884
Grades: PK-8
| 843 students
Rank: #1717.
Ps/ms 138 Sunrise
(Math: 13% | Reading: 28%)
Rank:
Rank:
1/
Bottom 50%10
251-11 Weller Ave
Rosedale, NY 11422
(929) 600-5777
Rosedale, NY 11422
(929) 600-5777
Grades: PK-8
| 626 students
Recent Articles

Year-Round Or Traditional Schedule?
Which is more appropriate for your child? A year-round attendance schedule or traditional schedule? We look at the pros and cons.

Why You Should Encourage Your Child to Join a Sports Team
Participating in team sports has a great many benefits for children, there is no doubt. In this article you will learn what those benefits are.

White Students are Now the Minority in U.S. Public Schools
Increasing birth rates among immigrant families from Asia and Central and South America, combined with lower birth rates among white families, means that for the first time in history, public school students in the United States are majority-minority. This shift in demographics poses difficulties for schools as they work to accommodate children of varying language abilities and socio-economic backgrounds.


